Resources
The Most Capable Oracle Monitoring Platform: Why AI-Driven Monitoring Leaves Traditional Tools Behind
3 November 2026
Traditional Oracle monitoring compares one number with one line, then waits for a person to do the rest. On a hard problem, that costs an hour or more, every time. Scops is the next generation: the most capable Oracle monitoring platform, AI-driven by design, with no agents and no extra Oracle licenses. It learns what is normal for every hour of every database, sees a problem when it starts, explains it in plain words with the database's own numbers, and puts the fix one click away. Every example below comes from the Scops screens.
What traditional monitoring does
A traditional tool watches each metric against a line that you set. CPU over 85%, a tablespace over 90%, a wait over so many milliseconds: when a number crosses its line, the tool raises an alert and draws it on a dashboard. For a few databases and a quiet afternoon, that was enough. A person read the screens, knew what normal looked like, and acted in time.
Oracle is not run like that any more. One DBA team looks after hundreds of databases, each with its own busy hours, under applications that do not wait. The tool still compares one number with one line, and that is where the hours go.
Where a threshold loses the hour
| The situation | Why a threshold misses it |
|---|---|
| The alert that is wrong at 3am | A line that fits the noon load fires all night in the batch window. The real problem hides under a hundred false alarms, and the on-call DBA learns to ignore the pager. |
| The problem with no line to cross | A plan that changed, a connection leak, a pile-up that builds over an hour: each single reading looks normal. The problem is the shape over time, and a threshold sees one point. |
| The limit nobody draws a line for | A range-partitioned table that runs out of partitions, a sequence near MAXVALUE, db_files near its limit. A threshold setup rarely covers them, so the first sign is ORA-14400 or ORA-08004 in the middle of the night. |
| The person in the middle | Someone reads five screens, correlates them, opens AWR (a licensed pack) and runs the queries. By then the outage has happened. That is an hour for each incident, for each DBA. |
A real case: two plans change on SALESPRD
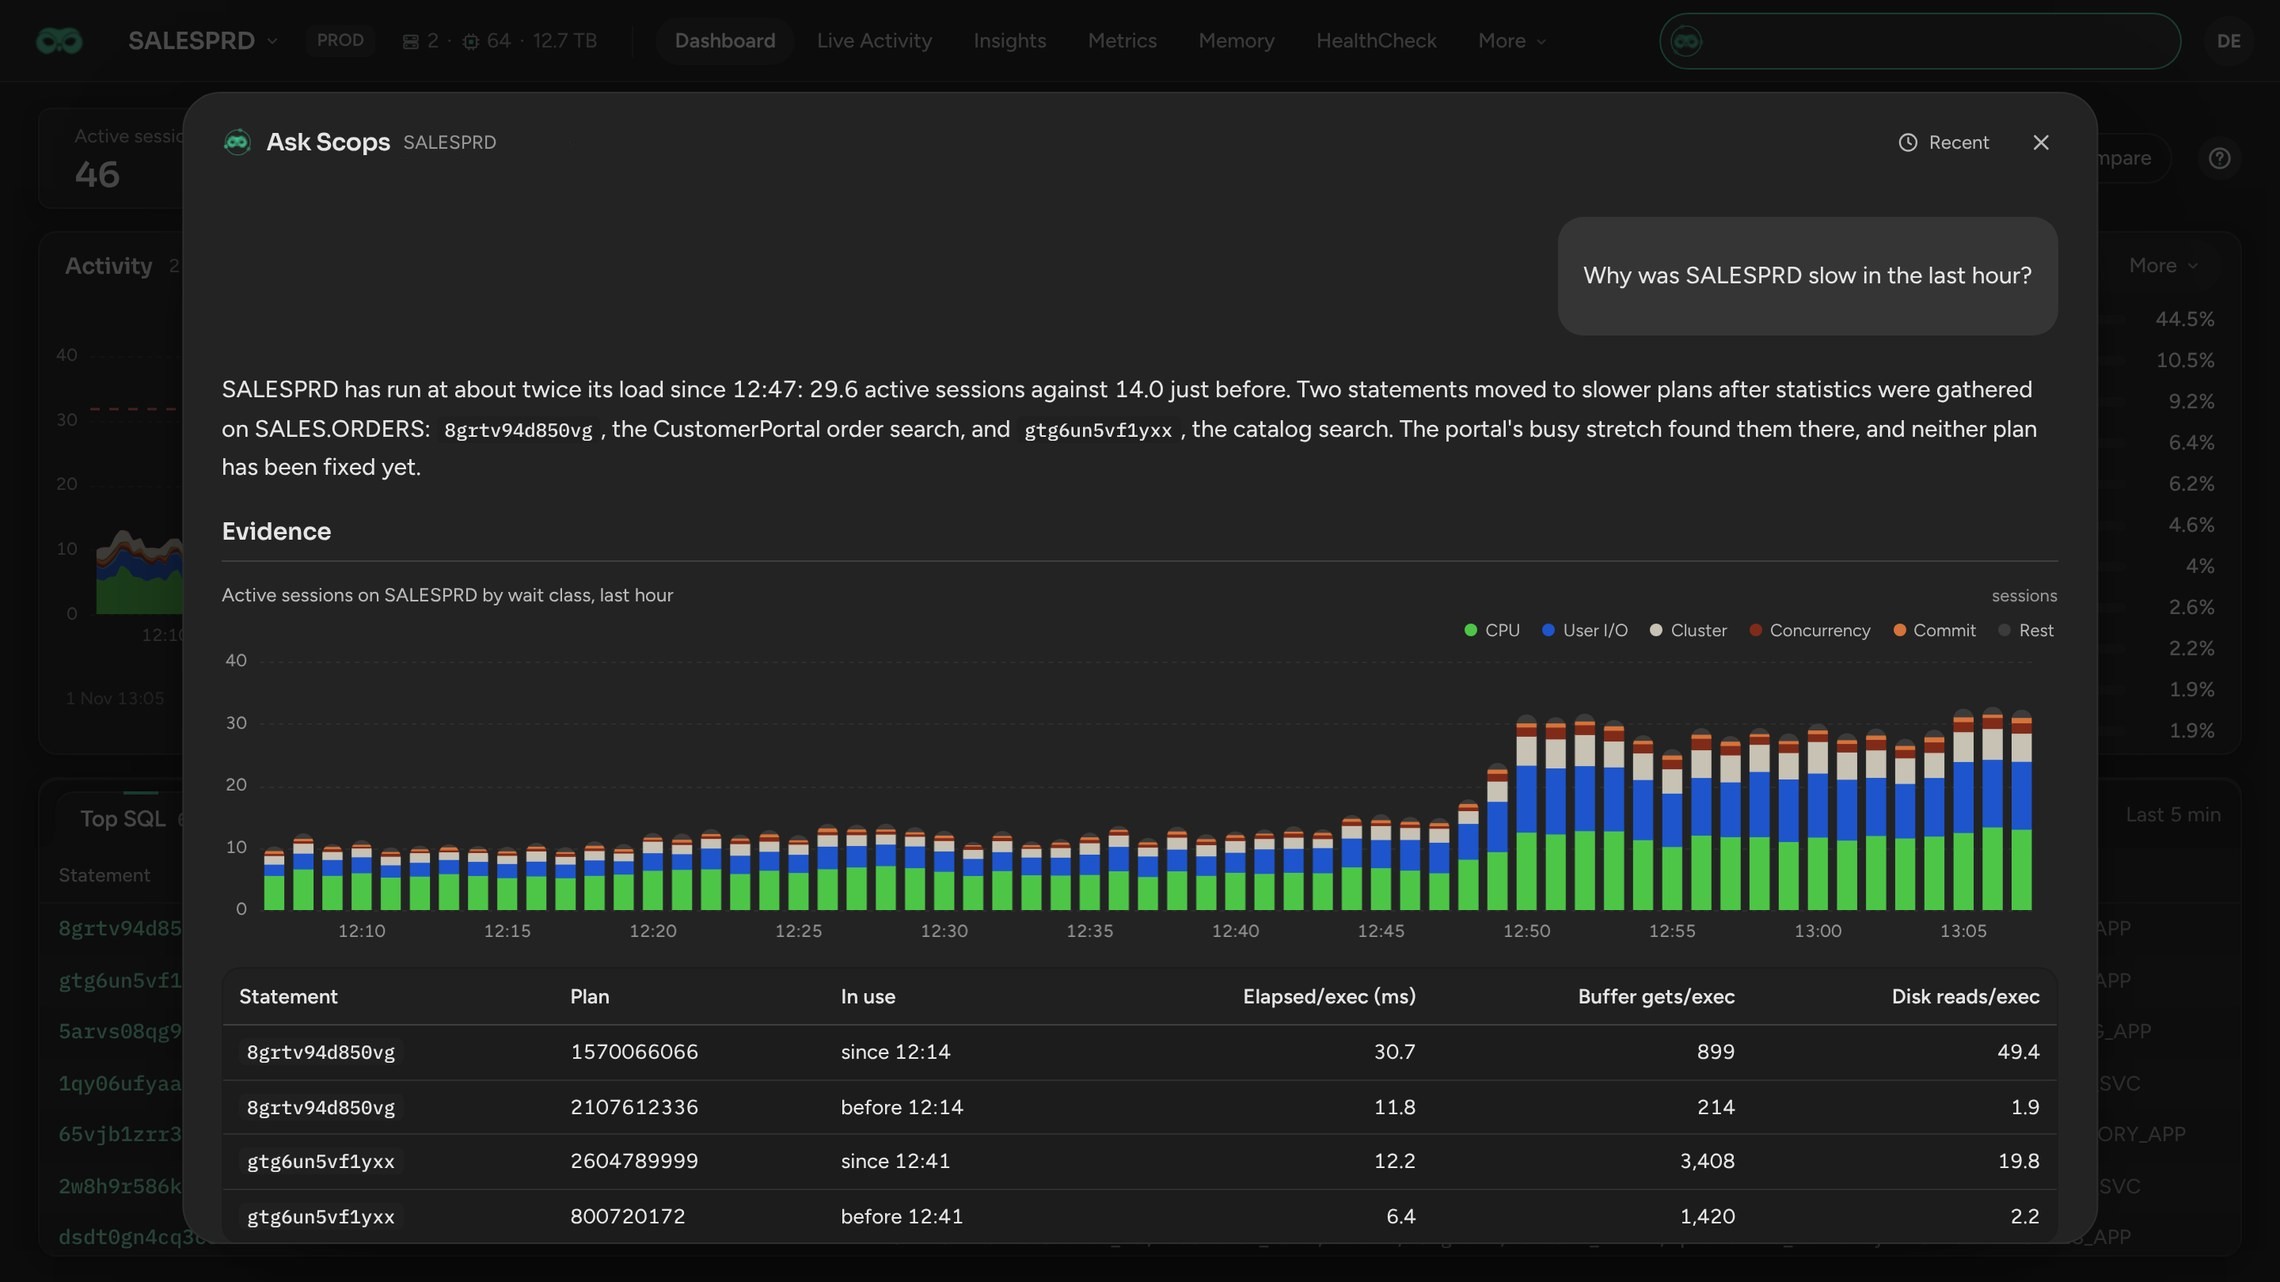
Here is one afternoon on SALESPRD, as Scops shows it. After statistics were gathered on SALES.ORDERS, the CustomerPortal order search, 8grtv94d850vg, moved to a new plan at 12:14. The catalog search, gtg6un5vf1yxx, did the same at 12:41. At 12:47 the portal's busy stretch found both, and the database ran at twice its load: 29.6 active sessions against 14.0 just before.
Look at what changed for each run. The order search went from 11.8 ms to 30.7 ms, with 26 times the disk reads. The catalog search went from 6.4 ms to 12.2 ms. A threshold on CPU or active sessions sees none of this. It sees the two statements only when the traffic comes and they hurt.
With a traditional tool, nothing fires at 12:14 or at 12:41. At 12:47 the load doubles, and when it stays high long enough, an alert pages the DBA. Then the slow part starts: find the statements, find out why, compare the plans in AWR, and set the old plans back by hand. The portal stays slow for about an hour.
With Scops, Radar Engine checks every database every 5 minutes, and a statement on a new plan is a finding of its own. The order search is on the Radar tab by 12:24, more than 20 minutes before the busy stretch, and one click on Fix plan puts its old plan back. The catalog search follows at 12:51. The portal is slow for minutes, not an hour.
Ask why, in plain words
Ask Scops AI the question your manager would ask, and it answers with the database's own data. Scops AI carries 40+ agentic tools and reads what Scops collected: activity, statements and plans, sessions, space, health, alerts and Radar findings. This is its answer for SALESPRD:
To fix it, ask for it: "set 8grtv94d850vg back to its old plan". Scops AI shows a card with the statement, the database and what it checked. Only a click on Fix plan changes anything, and Scops reads the database again before it acts. Fix plan uses Oracle's Diagnostics and Tuning Pack, so it sits behind a license switch: a pack is never used by accident.
Or let Scops do it by itself. With automatic plan fix, the SQL Plan Change alert sets a slow statement back to its best recent plan with a SQL profile, checks over the next runs that the fix helps, and rolls back a fix that does not.
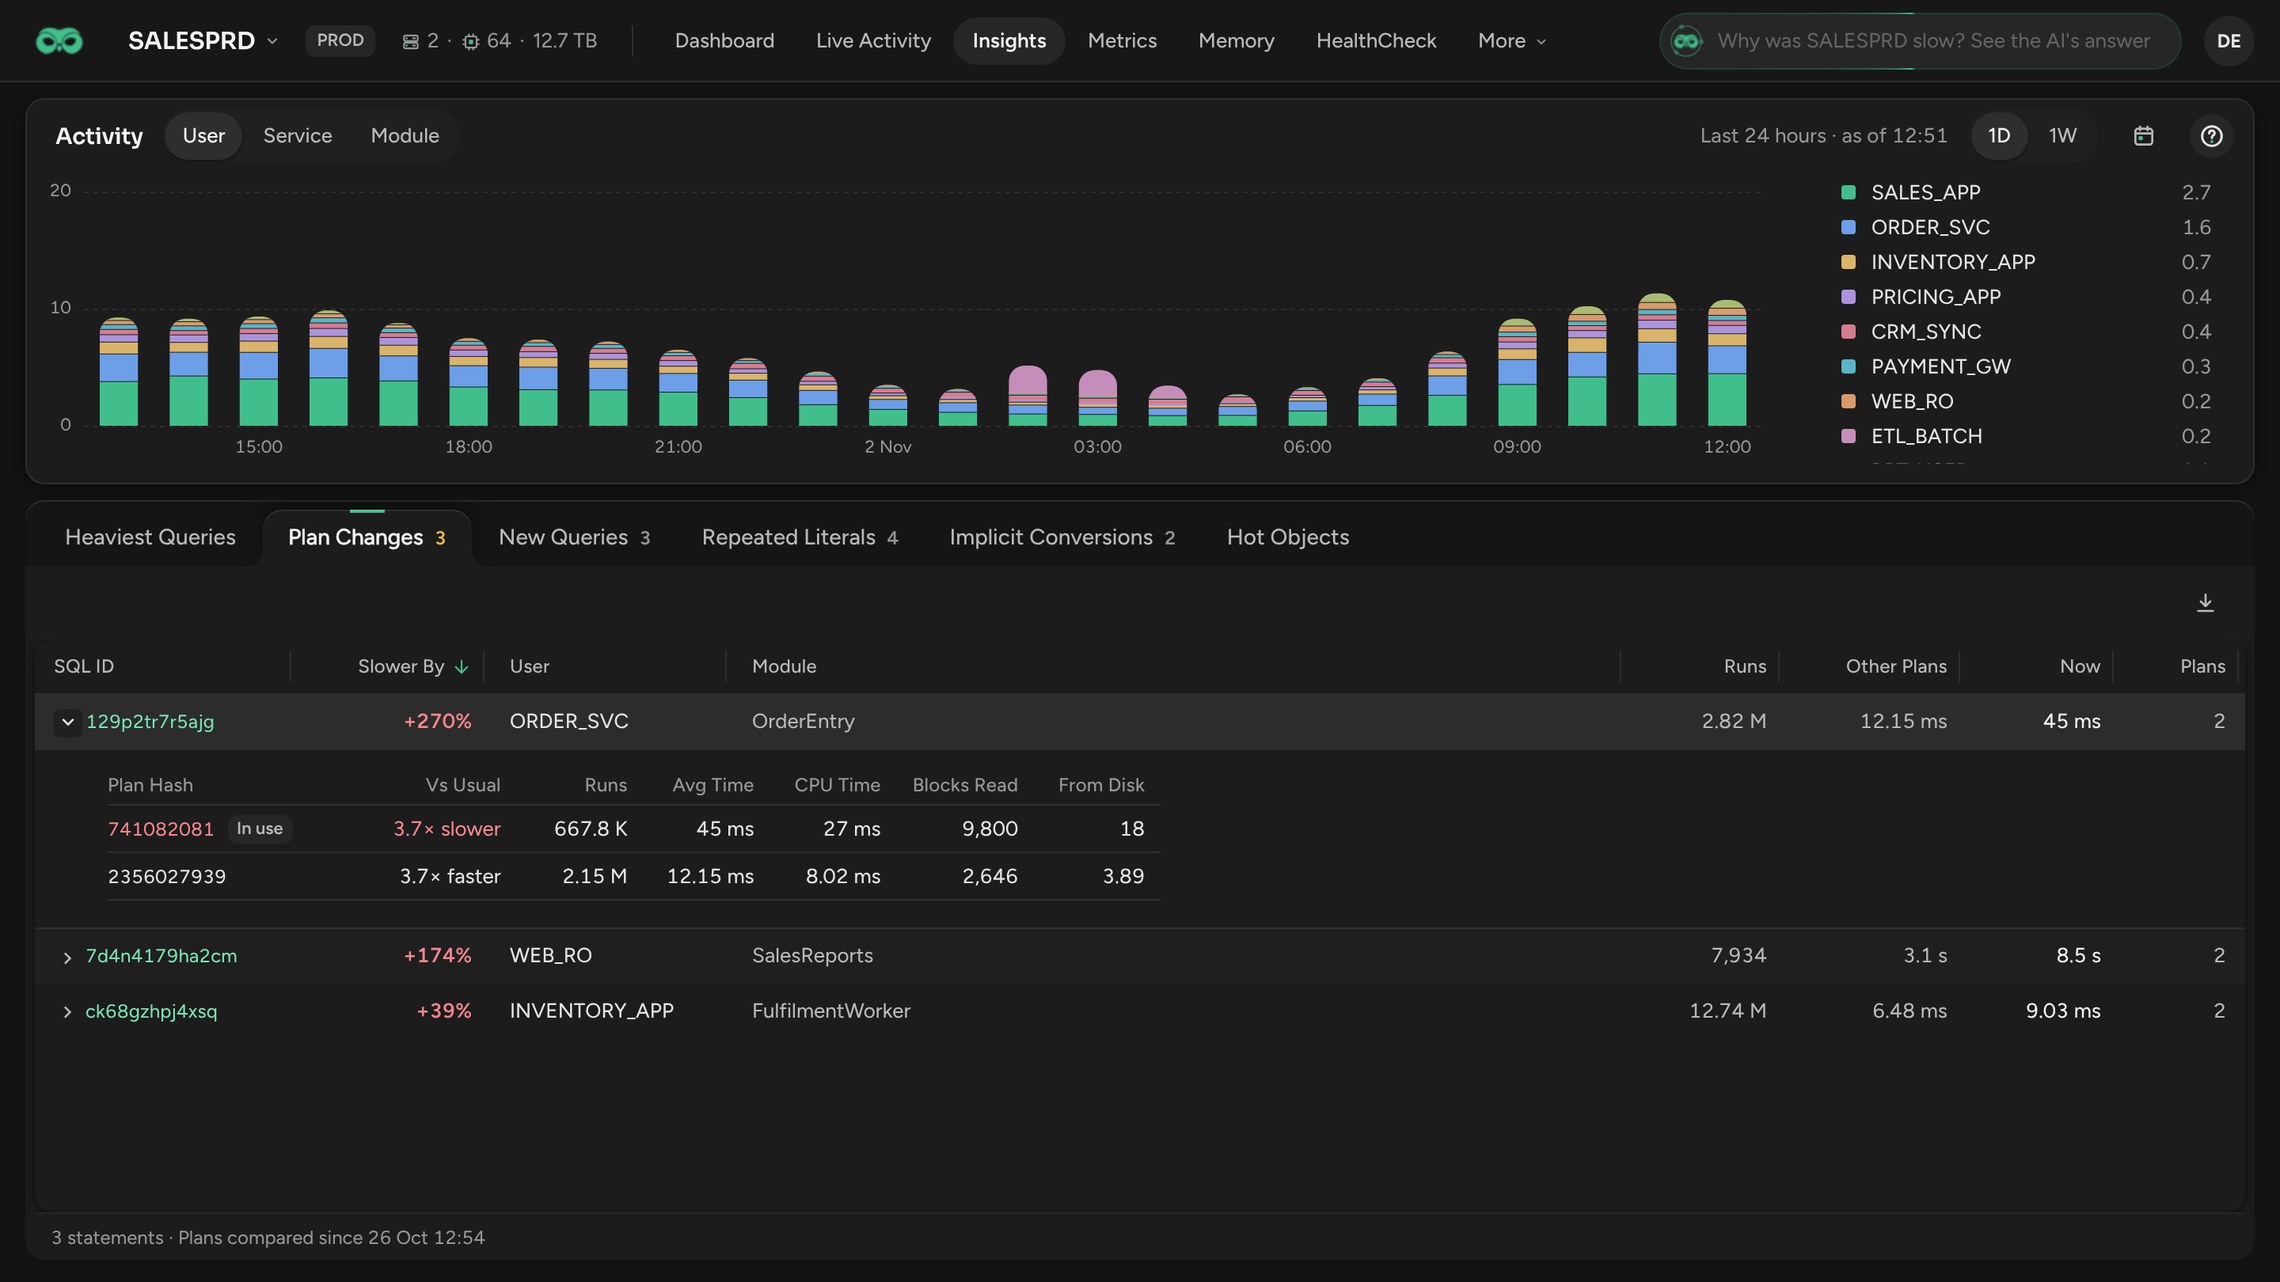
You do not even need to ask. Insights lists every statement that runs at least 20% slower on its current plan than on its other plans, over the last 7 days, and it needs no AWR or Diagnostics Pack.
The same speed on every hard problem
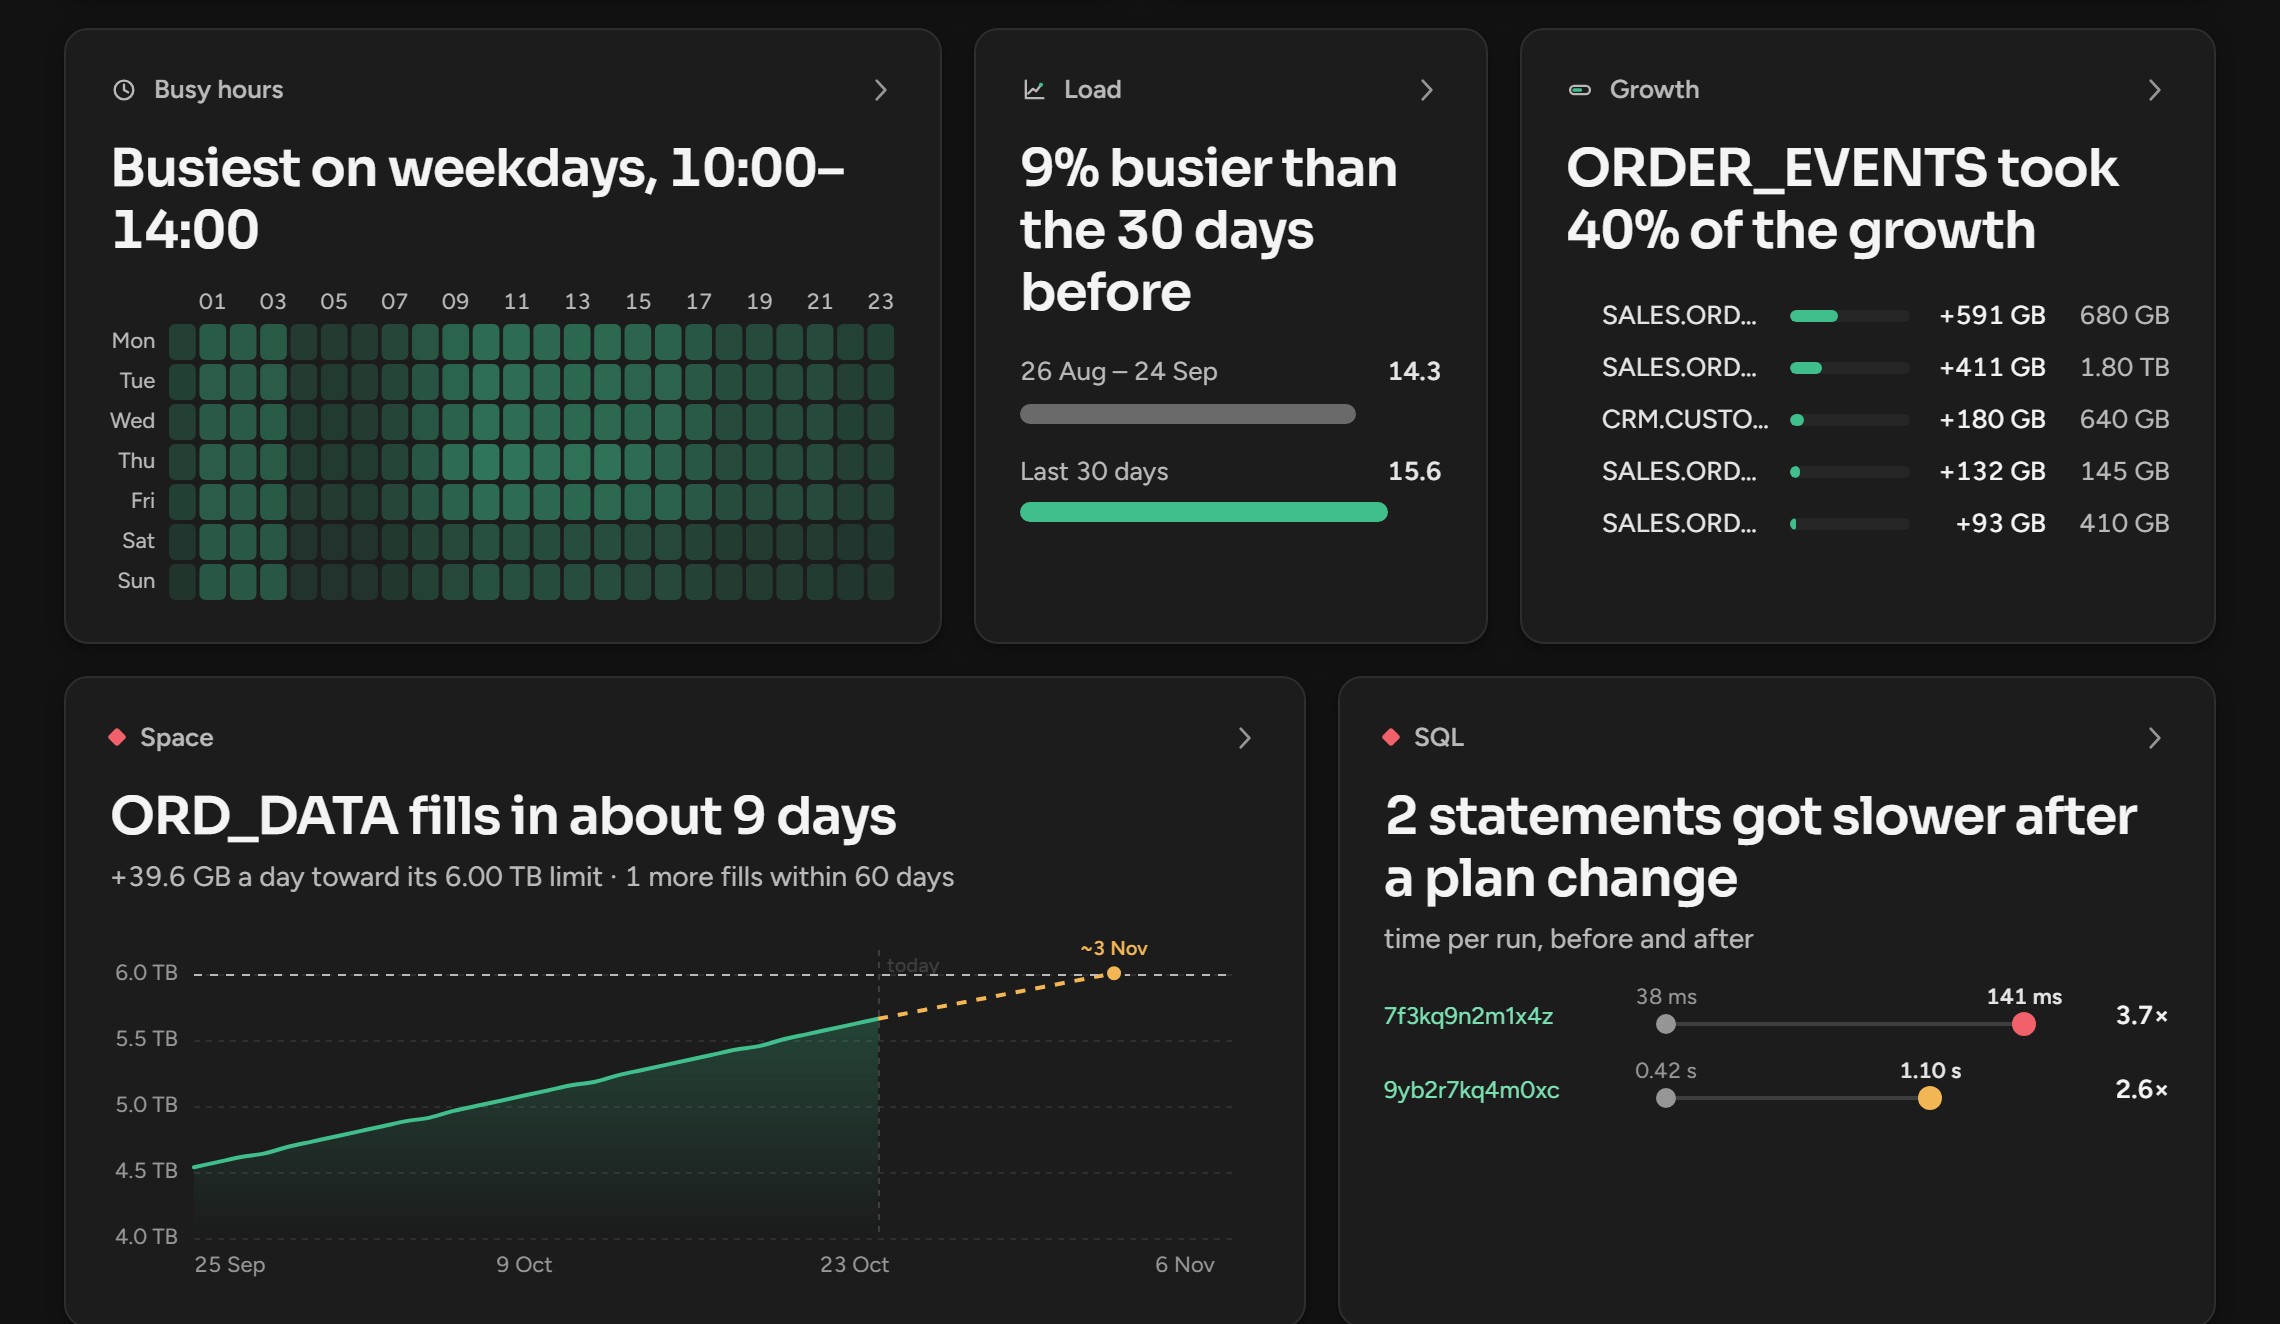
Plan changes are one case. Radar Engine runs 75+ detectors on the same 5-minute cycle, with hourly and daily checks for space, limits and objects. It learns the usual level of every hour, for weekdays and weekends apart, so a finding means something. Each finding is one sentence with the object and the numbers, the cause, and the first step.
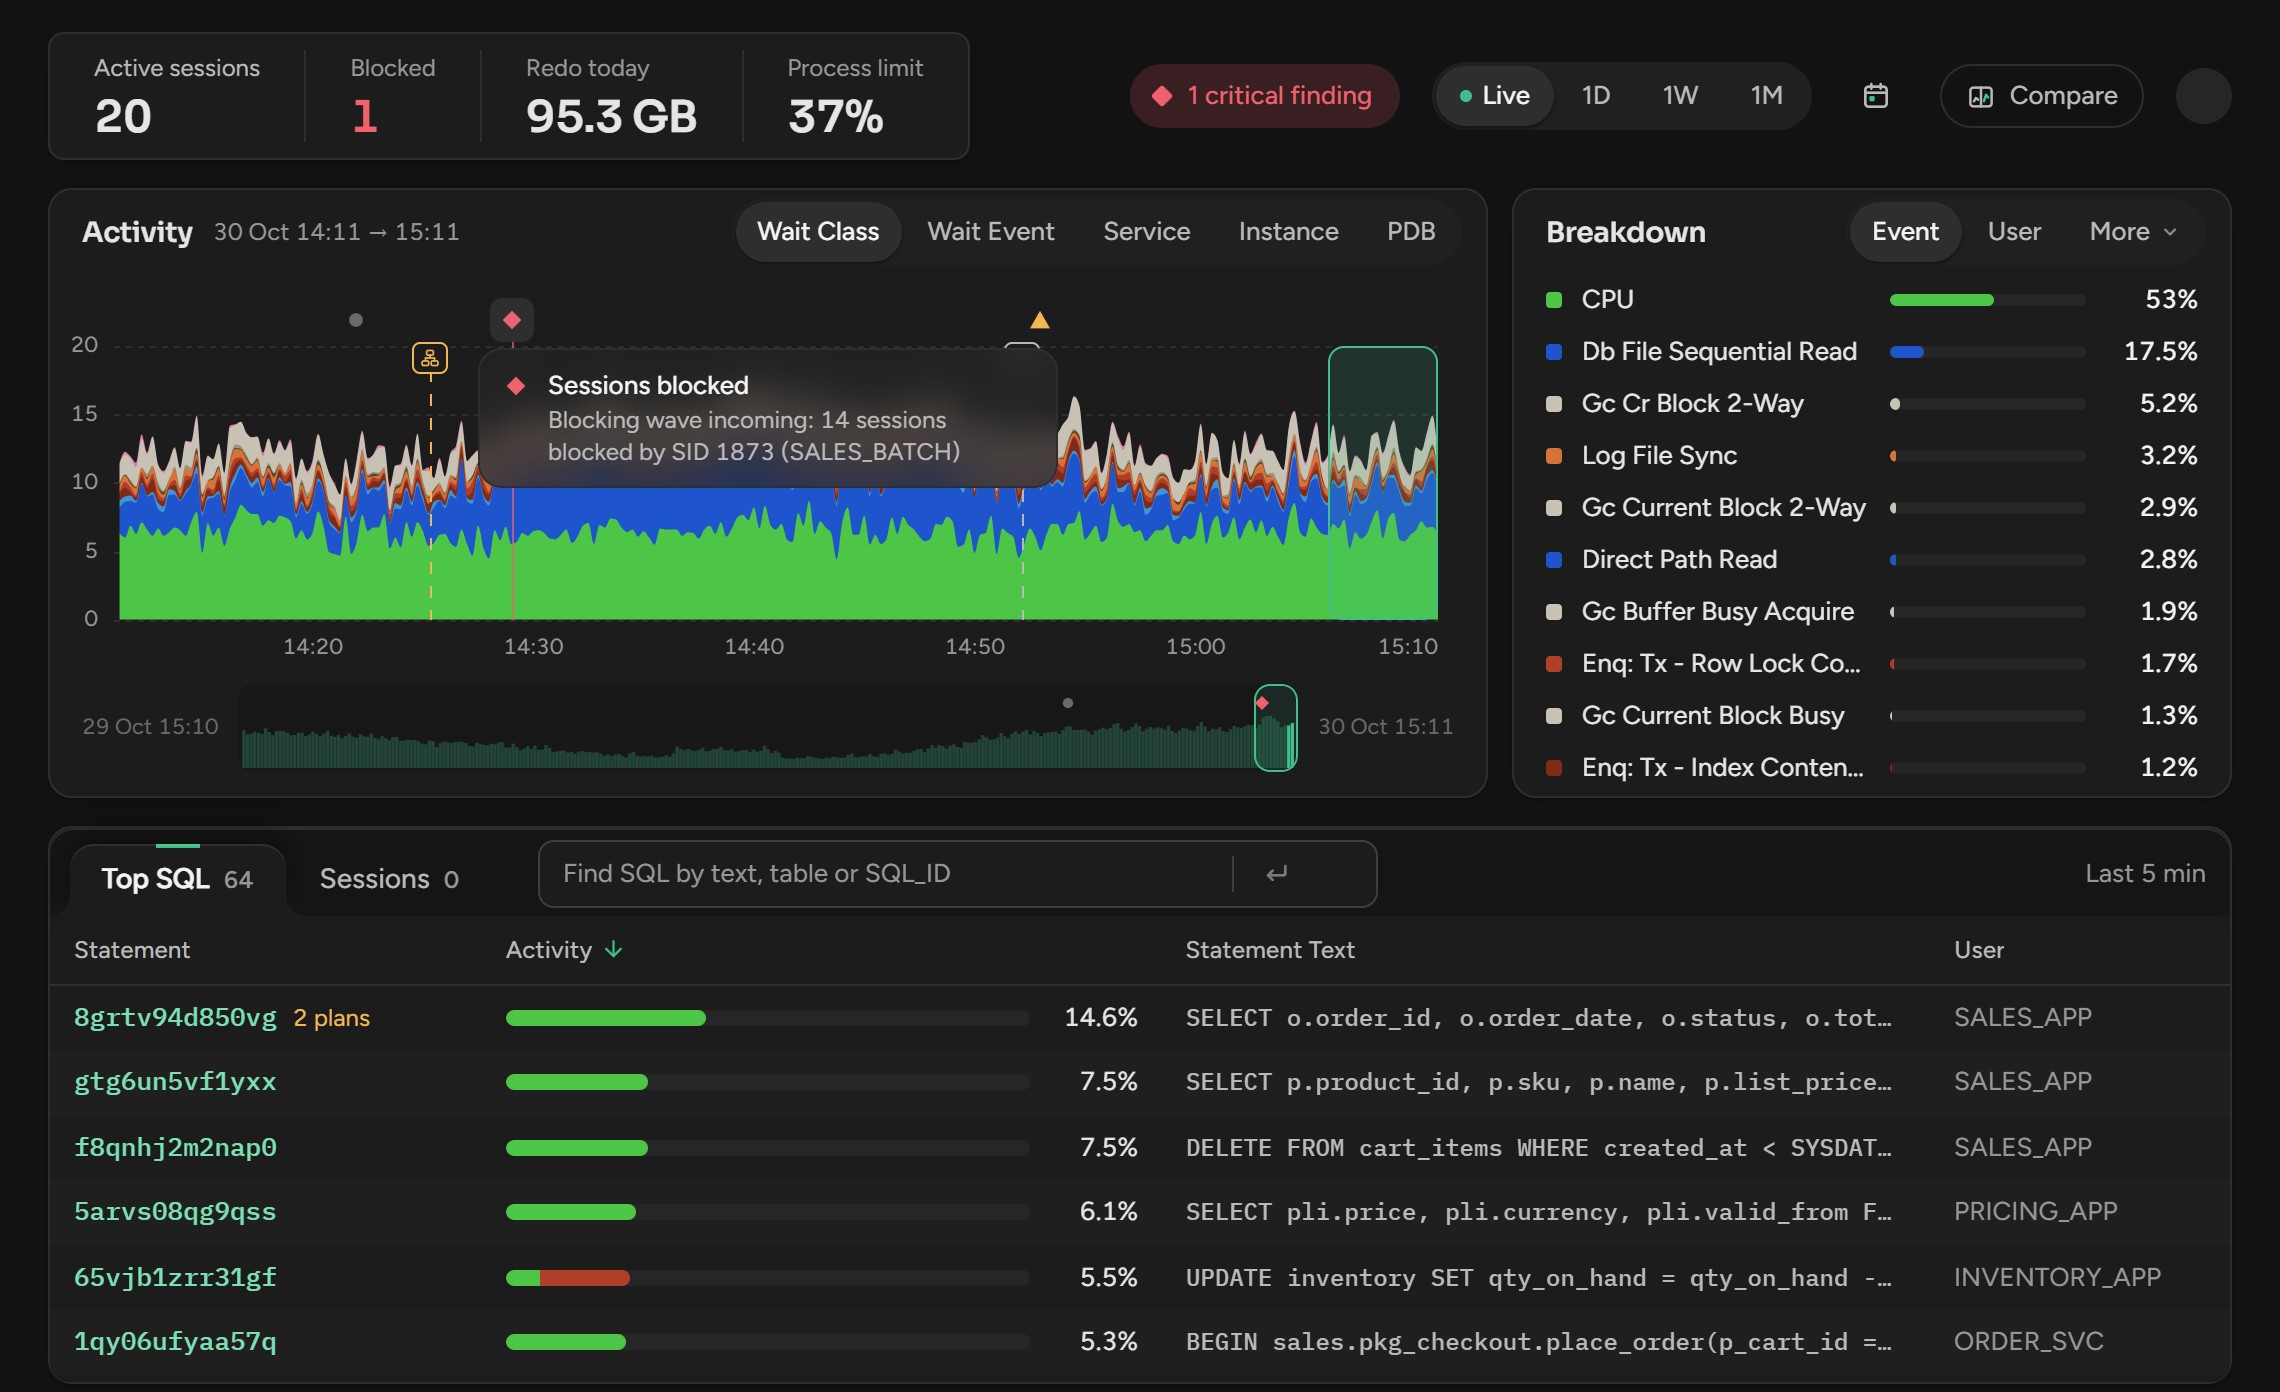
Blocking wave incoming
Recovery area full in about 5 hours
Tablespace ERP_DATA full in about 3 days
db_files reaches 100% in two months
| The problem | A threshold tool | Scops |
|---|---|---|
| A blocking chain | An alert on a session count or a wait, after the pile-up. Then a hunt through V$SESSION for the root blocker. | "14 sessions blocked by SID 1873 (SALES_BATCH)", marked on the activity chart and mailed at once. Scops AI can kill the blocker from a card, and it checks again that the session still blocks. |
| The recovery area fills | An alert at a fixed percentage, sometimes minutes before ORA-00257 stops every change. | A forecast from the real fill rate. Critical when the area is 80% full and full within 6 hours. |
| A tablespace grows | An alert at 90%, whatever the rate. | A date: "ORD_DATA fills in about 9 days", at +39.6 GB a day toward its 6.00 TB limit. |
| Partitions, sequences, db_files | Usually nothing, until ORA-14400 or ORA-08004. | Daily checks with a date: a Warning 21 days before the last range partition runs out, and sequences and db_files near their limits. |
Why Scops is the most capable Oracle monitoring platform
AI-driven is half of it. Scops is also the platform that asks the least of you and gives the most back:
- Agentless. Nothing on your database servers: one read-only connection per database.
- No extra Oracle licenses. Scops samples sessions every 5 seconds and collects SQL statistics itself, so monitoring needs no Diagnostics or Tuning Pack, and it monitors Standard Edition 2 in full.
- 75+ Radar detectors that learn the usual level of every hour and give a date instead of a red light.
- Scops AI with 40+ agentic tools, the most capable AI assistant for Oracle. It proves every answer with the database's own data and changes nothing without a click.
- Automation that fixes what it finds: plan fix, statistics, compression, archiving and automatic datafiles.
- A price that falls as you grow. Free for 2 databases. Then $499 per database a year, and each further database costs 5% less, down to half the list price.
Thresholds tell you that a number is high. Scops tells you what is about to break, why, and how to stop it, and then it stops it. That is the next generation of Oracle monitoring, and it is why Scops is the most capable Oracle monitoring platform.
Questions
Is AI-driven monitoring just alerts with a new name?
No. A threshold compares one number with one line. Scops learns the usual level of every hour for every database, forecasts from the real rate of change, folds the signals into one finding with a cause, explains it in plain words and fixes it. A plan change or a slow leak has no line to cross, and that is exactly what thresholds miss.
How fast does Scops see a plan change?
Within three Radar cycles, about 15 minutes. Radar Engine checks every database every 5 minutes, and a statement on a new plan is a finding of its own. A new plan that makes a statement three times slower and adds a full active session is Critical.
Does AI-driven monitoring replace my DBA?
No. It removes the hour of correlation, not the DBA. Scops hands over the answer and the fix in minutes, so the DBA spends the time on the decision, not on five screens at 3am.
Does Scops need extra Oracle licenses?
No. Scops is agentless and needs no Diagnostics or Tuning Pack to monitor. It samples sessions every 5 seconds and collects SQL statistics every 10 minutes itself, and it works the same on Standard Edition 2 as on Enterprise Edition. The one feature that uses the packs, plan fix, sits behind a license switch, so a pack is never used by accident.
What does Scops AI send to the model?
Masked names and typed placeholders, never application rows, bind values or passwords. It runs only fixed read-only queries and changes nothing without a click on a card.
How many databases can one team watch this way?
As many as it runs. Scops already watches 750+ Oracle databases, and one window shows all of yours, because the platform does the correlating and the forecasting, not the person.
Related
- Why Scops is the best Oracle monitoring tool
- Oracle SQL plan changed: find the old plan and get it back
- The best AI assistant for Oracle DBAs
- Catching Oracle problems before they become outages
- Oracle root cause analysis
- Oracle anomaly detection
- Oracle MCP Server vs Scops AI
- All articles
Sources
- Scops docs: How Radar works, Detector reference, Ask Scops AI, Automatic plan fix, Insights
- Oracle: Database Licensing Information (the Diagnostics and Tuning Packs need Enterprise Edition)