Insights
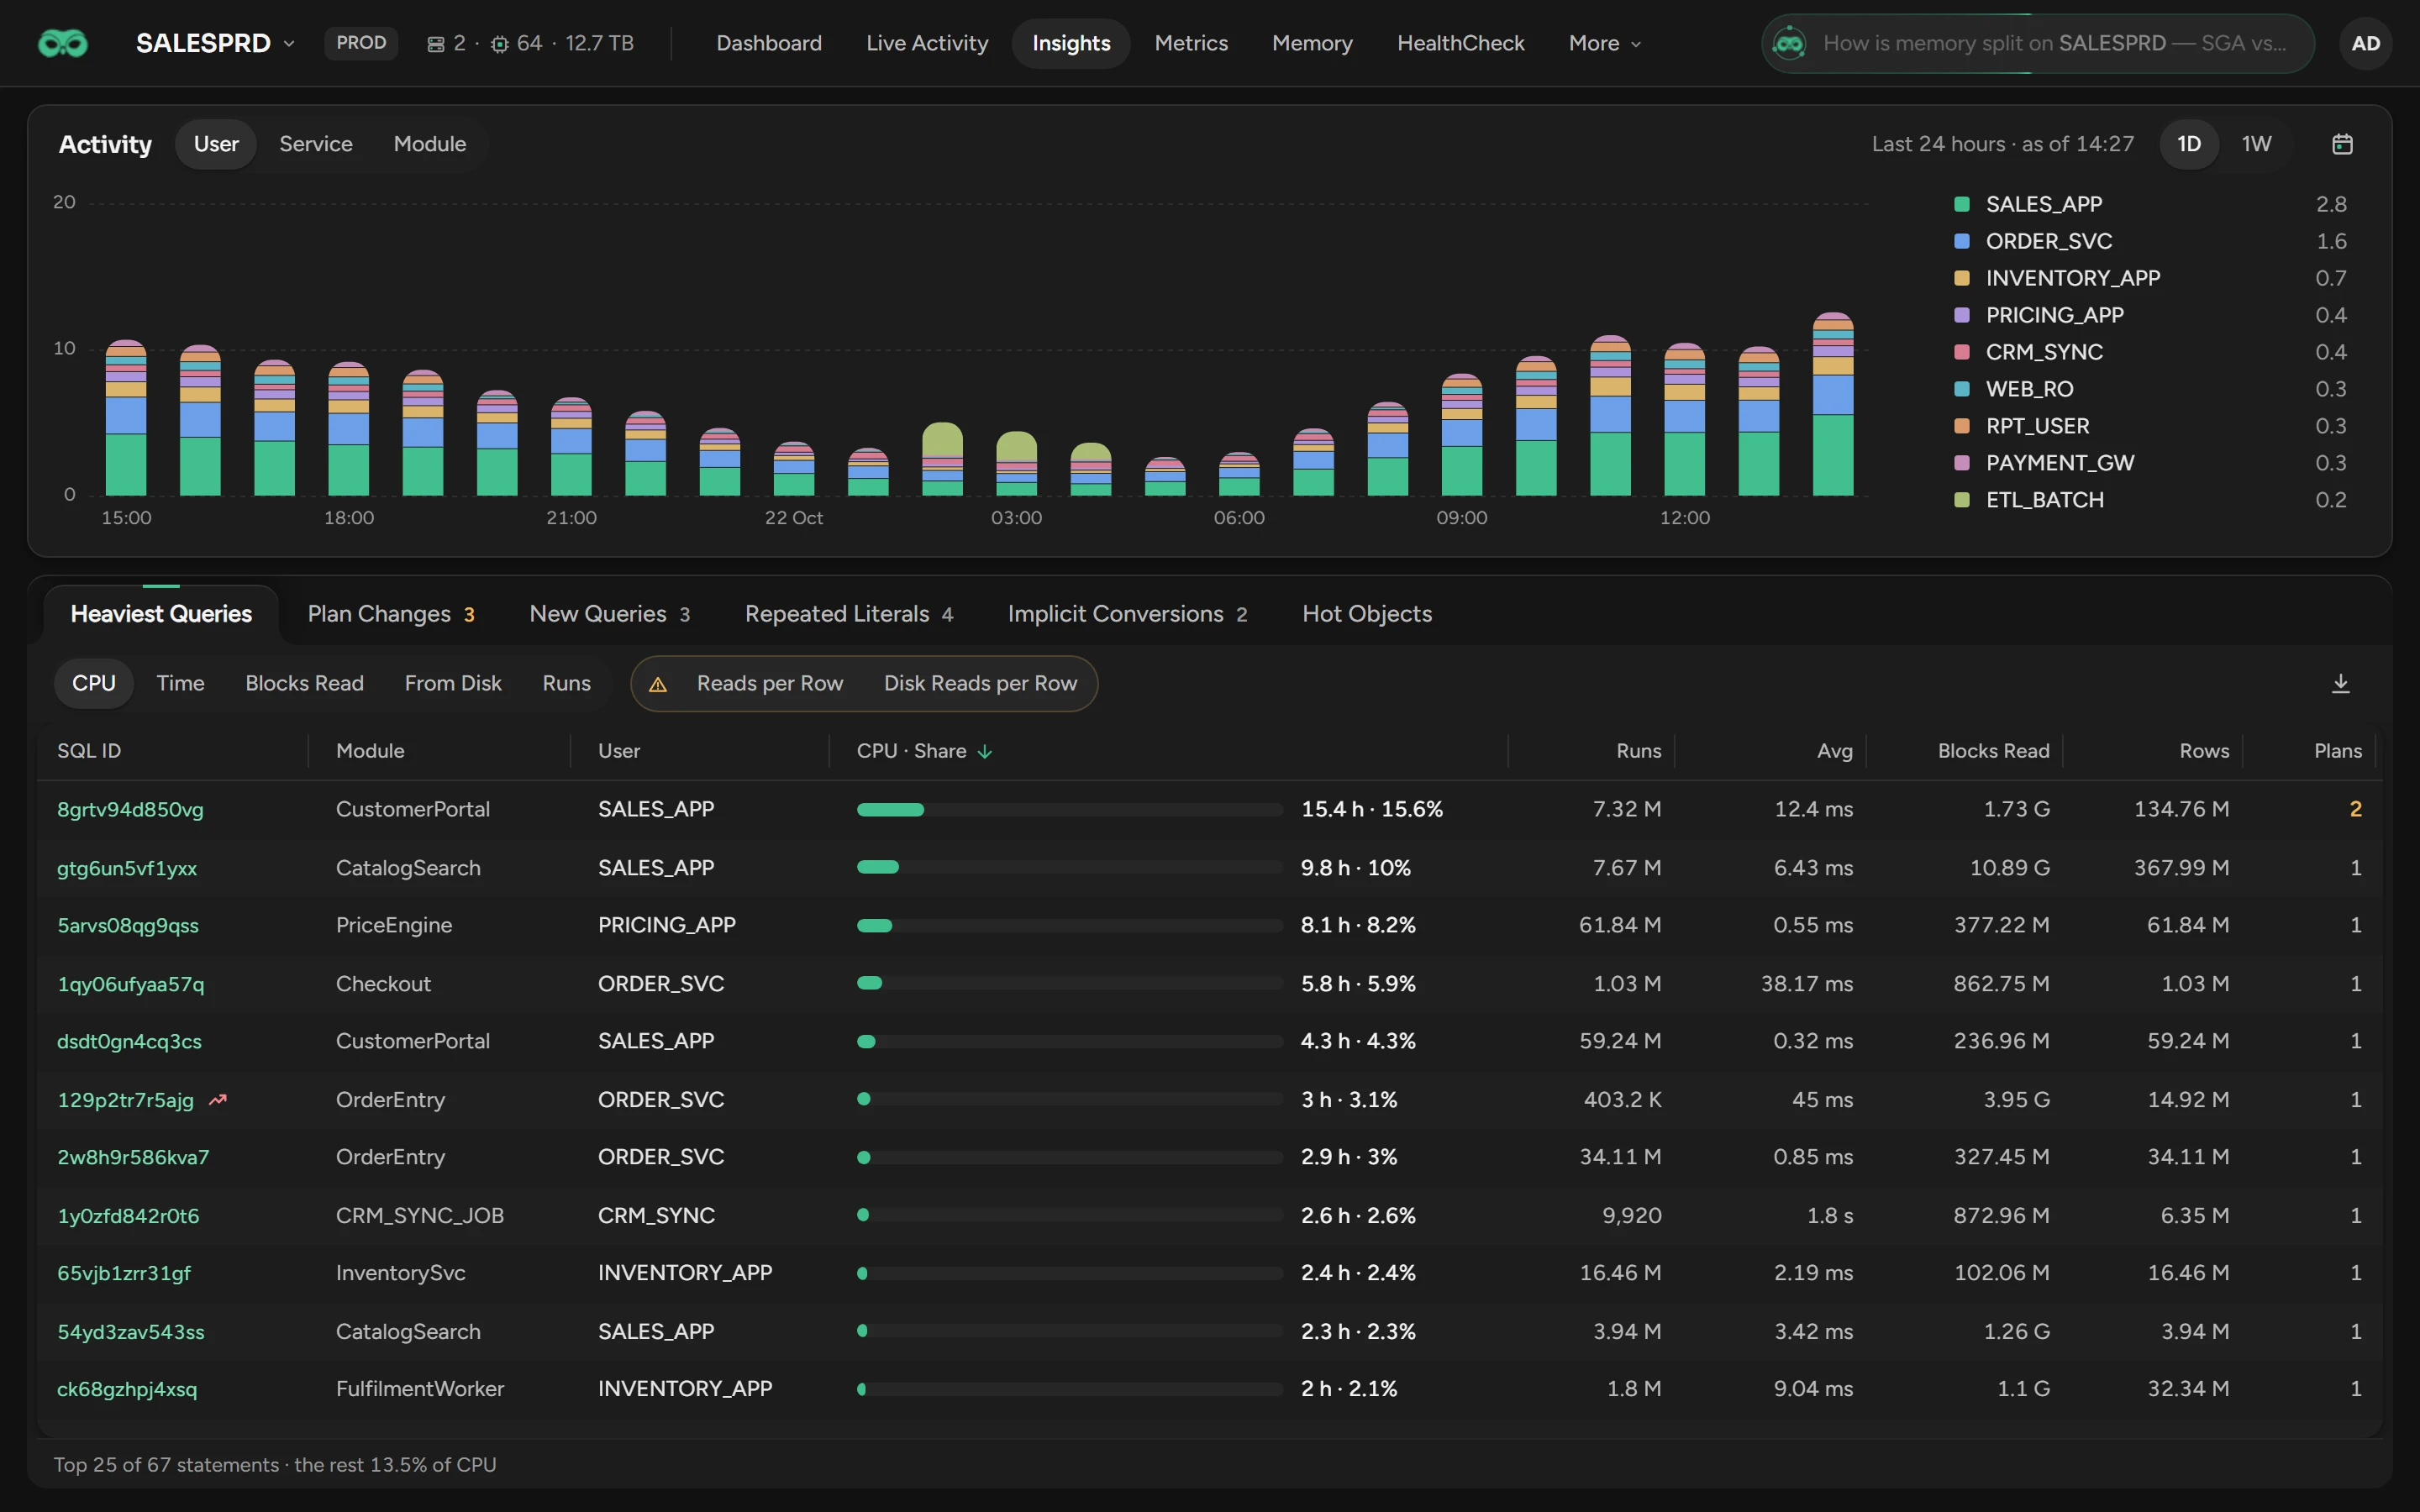
Use Insights to find which users, services and modules kept one database busy over a day or a week, and which statements need attention.
Before you begin
- You need the View Insights permission. Insights needs no AWR or Diagnostics Pack.
- The lists leave out Oracle schemas, the monitoring account, scheduler jobs, Data Pump, GoldenGate and the Oracle maintenance tasks.
Choose the window
Click 1D for the last 24 hours, one column per hour, or 1W for the last 168 hours, one column per six hours. For other full hours, up to 7 days, click the calendar button, select the start and the end, and click Apply.
Narrow to an application or an hour
In the Activity header, select User, Service or Module.
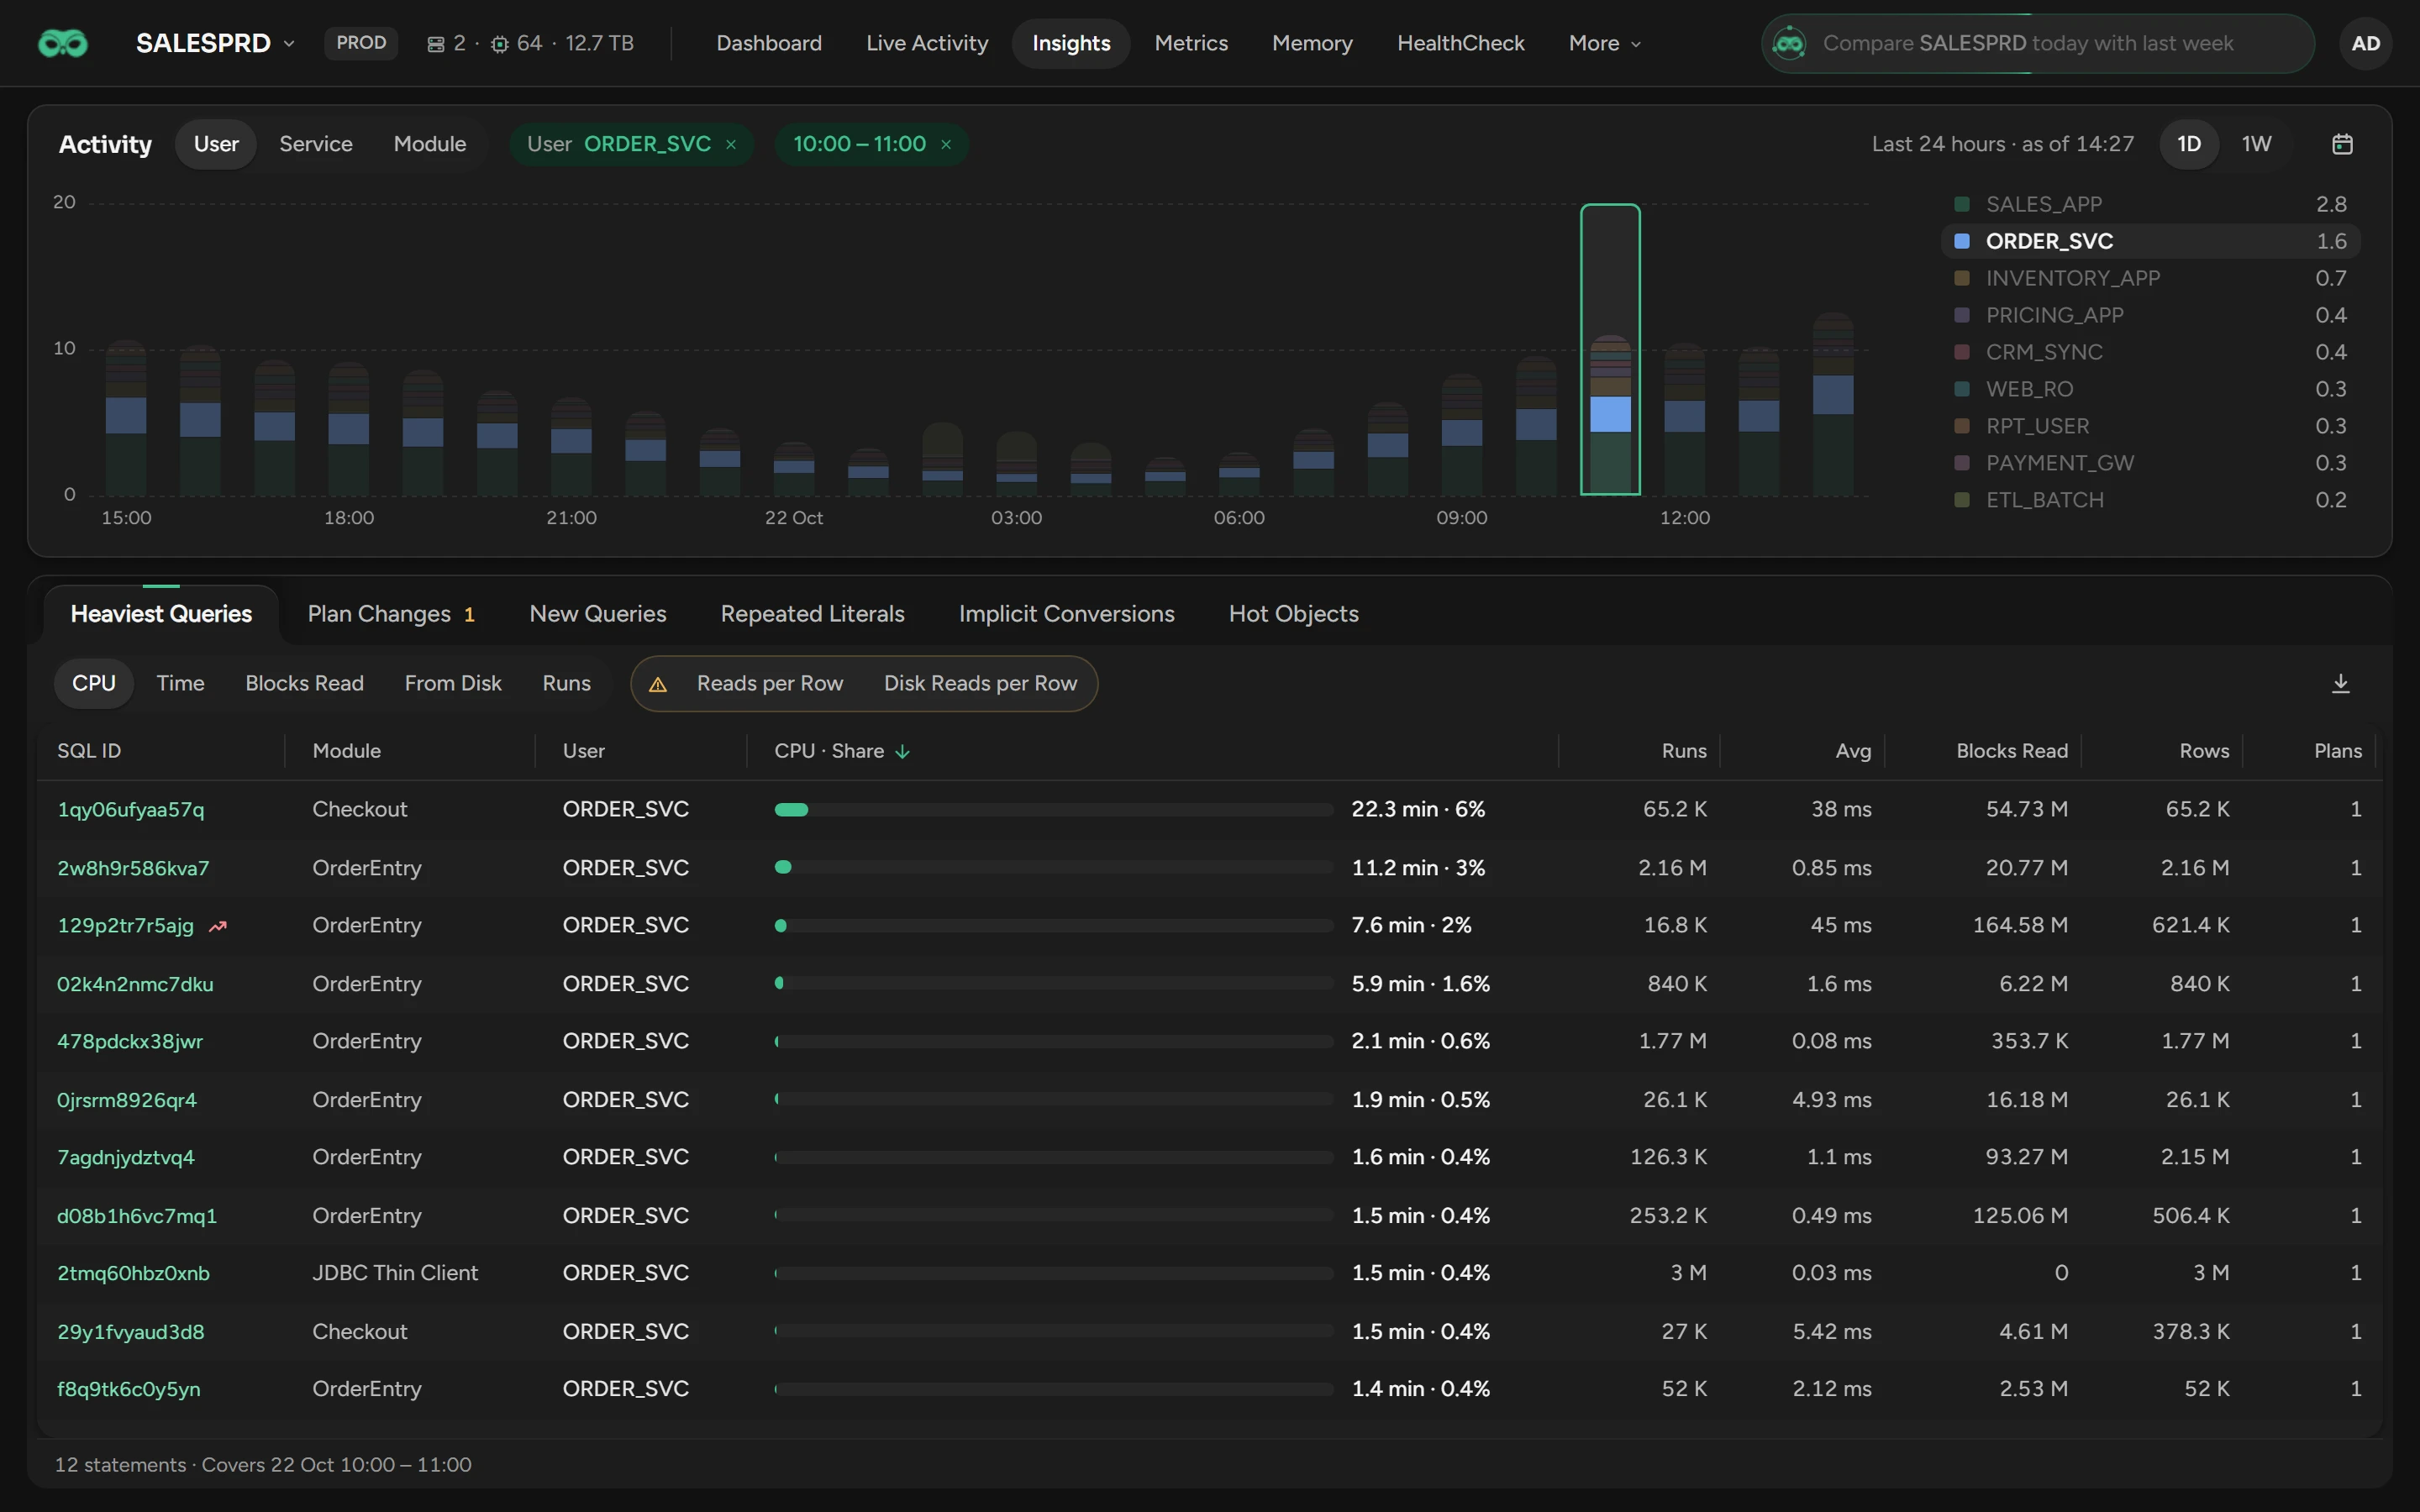
To show only one of them in the lists, click its legend row. You cannot select Other.
To measure the lists over the hours of one column, click the column.
To undo a click, click its chip in the header.
If a list is empty, click Query the Database for This Scope. A service has no such button.
Find the heaviest statements
Heaviest Queries lists the 25 statements that cost the most. Rank them by CPU, Time, Blocks Read, From Disk or Runs. To find the statements that read too much for each row, rank by Reads per Row or Disk Reads per Row.
| Mark | Meaning |
|---|---|
| A red arrow after the SQL ID | At least 3 times slower than on its other plans. |
| An amber warning sign | 5,000 blocks or more for each row: often a missing index or a full scan. |
| Plans in amber | More than one plan. |
Click a SQL ID to open its SQL details for the selected column or range, or else for the last hour.
Find statements on a slower plan
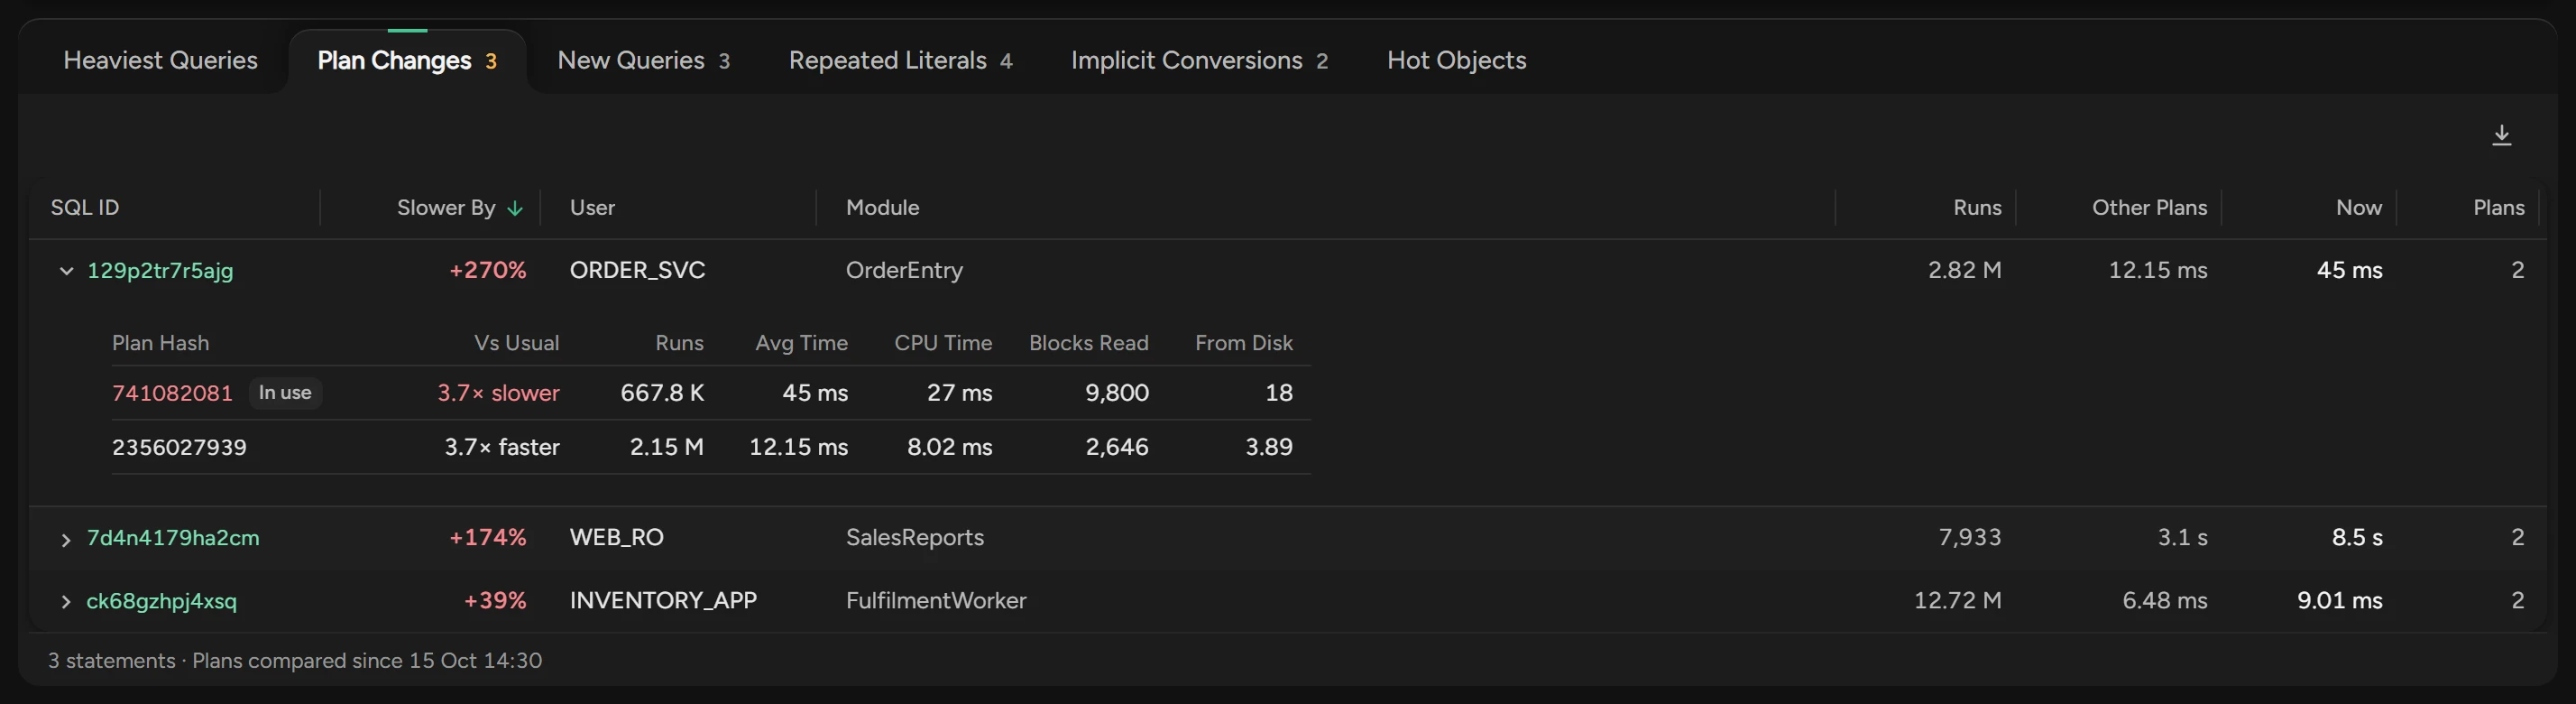
Plan Changes lists the statements that are at least 20% slower on their current plan than on their other plans. Scops compares the 7 days up to the end of the window.
Slower By compares Other Plans with Now, per run. Open a row to see all plans: In use marks the current one.
To put the statement back on a good plan, use Set SQL Plan.
Find new statements
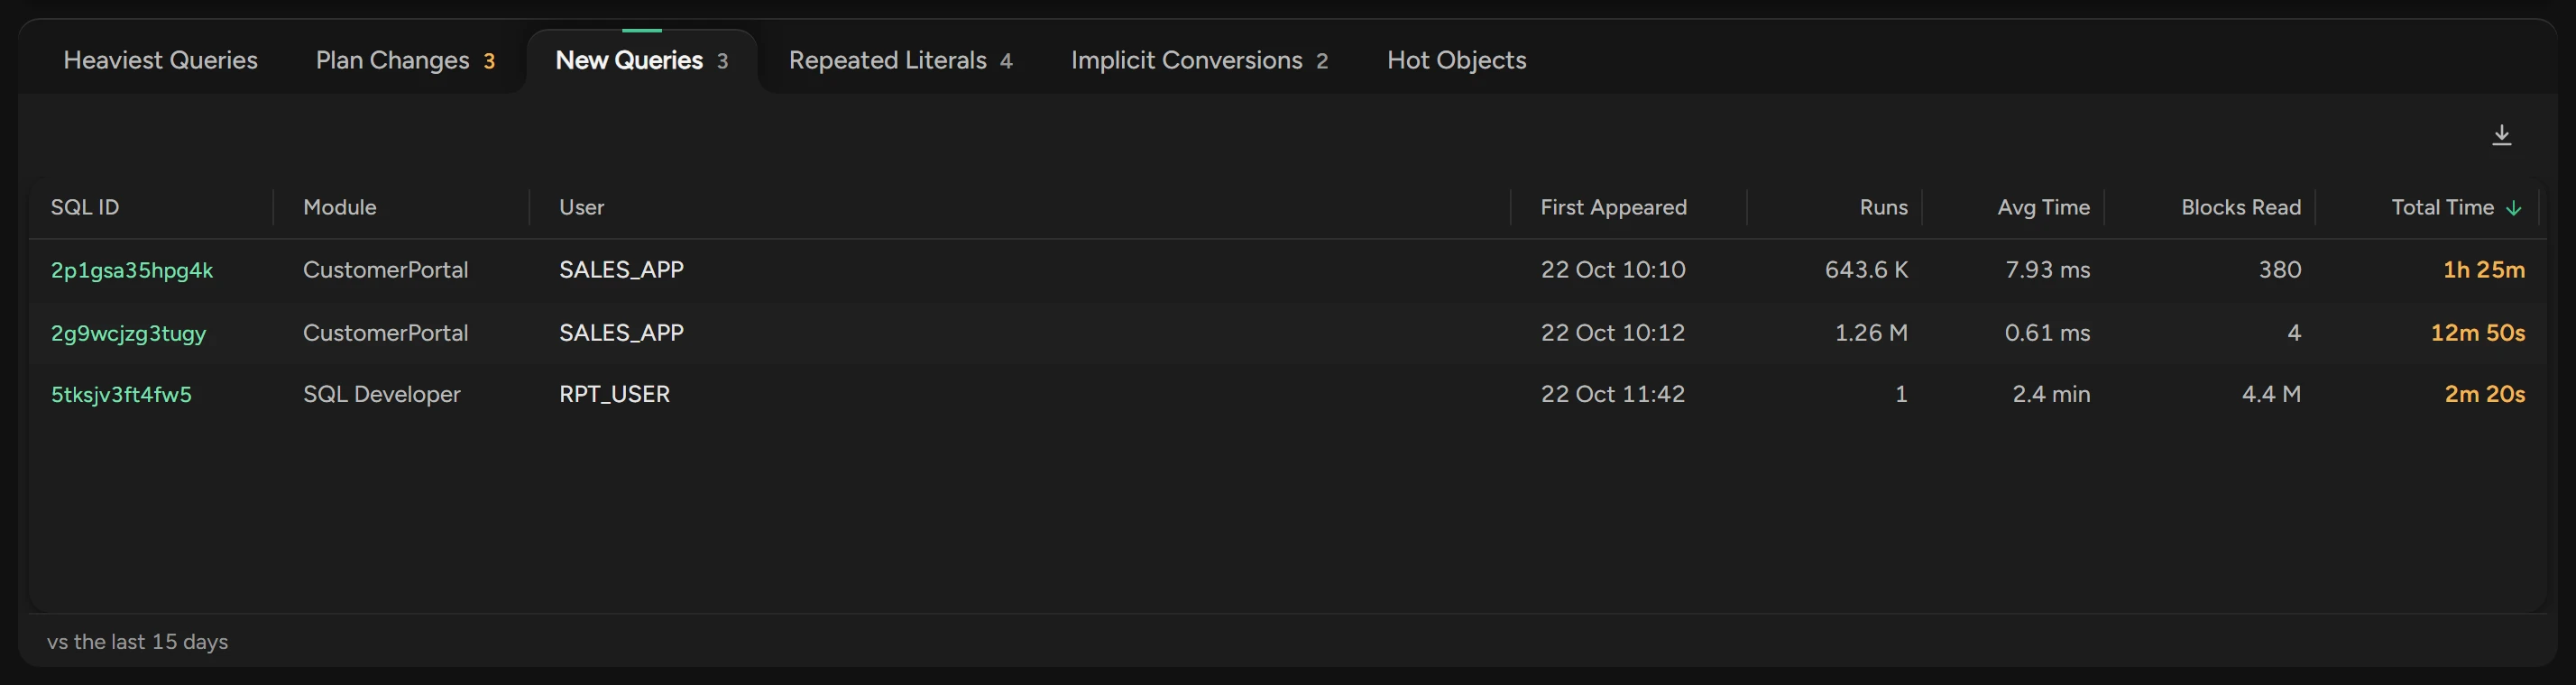
New Queries lists up to 100 statements that ran in the window but not in the 15 days before it, for example after a release.
Find statements without bind variables
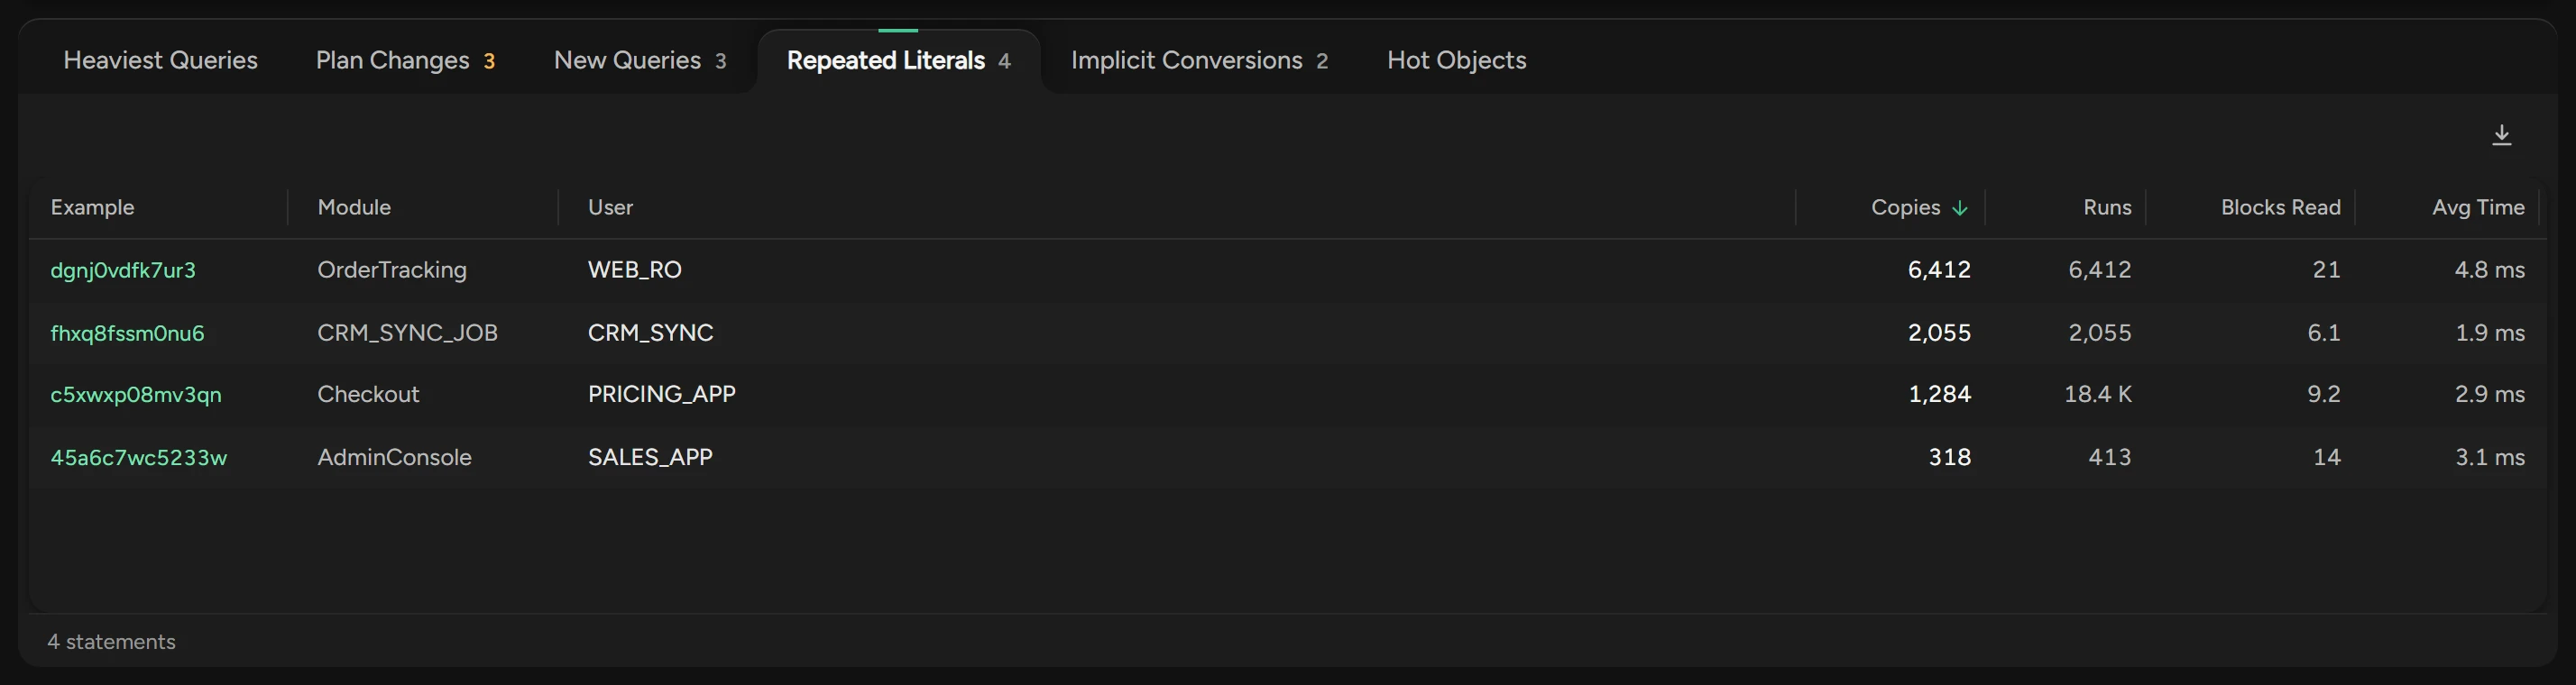
Repeated Literals groups the statements that differ only in their literal values into families, by force matching signature. A family shows when it has 5 or more Copies and more than 10 runs in the window.
Find implicit conversions
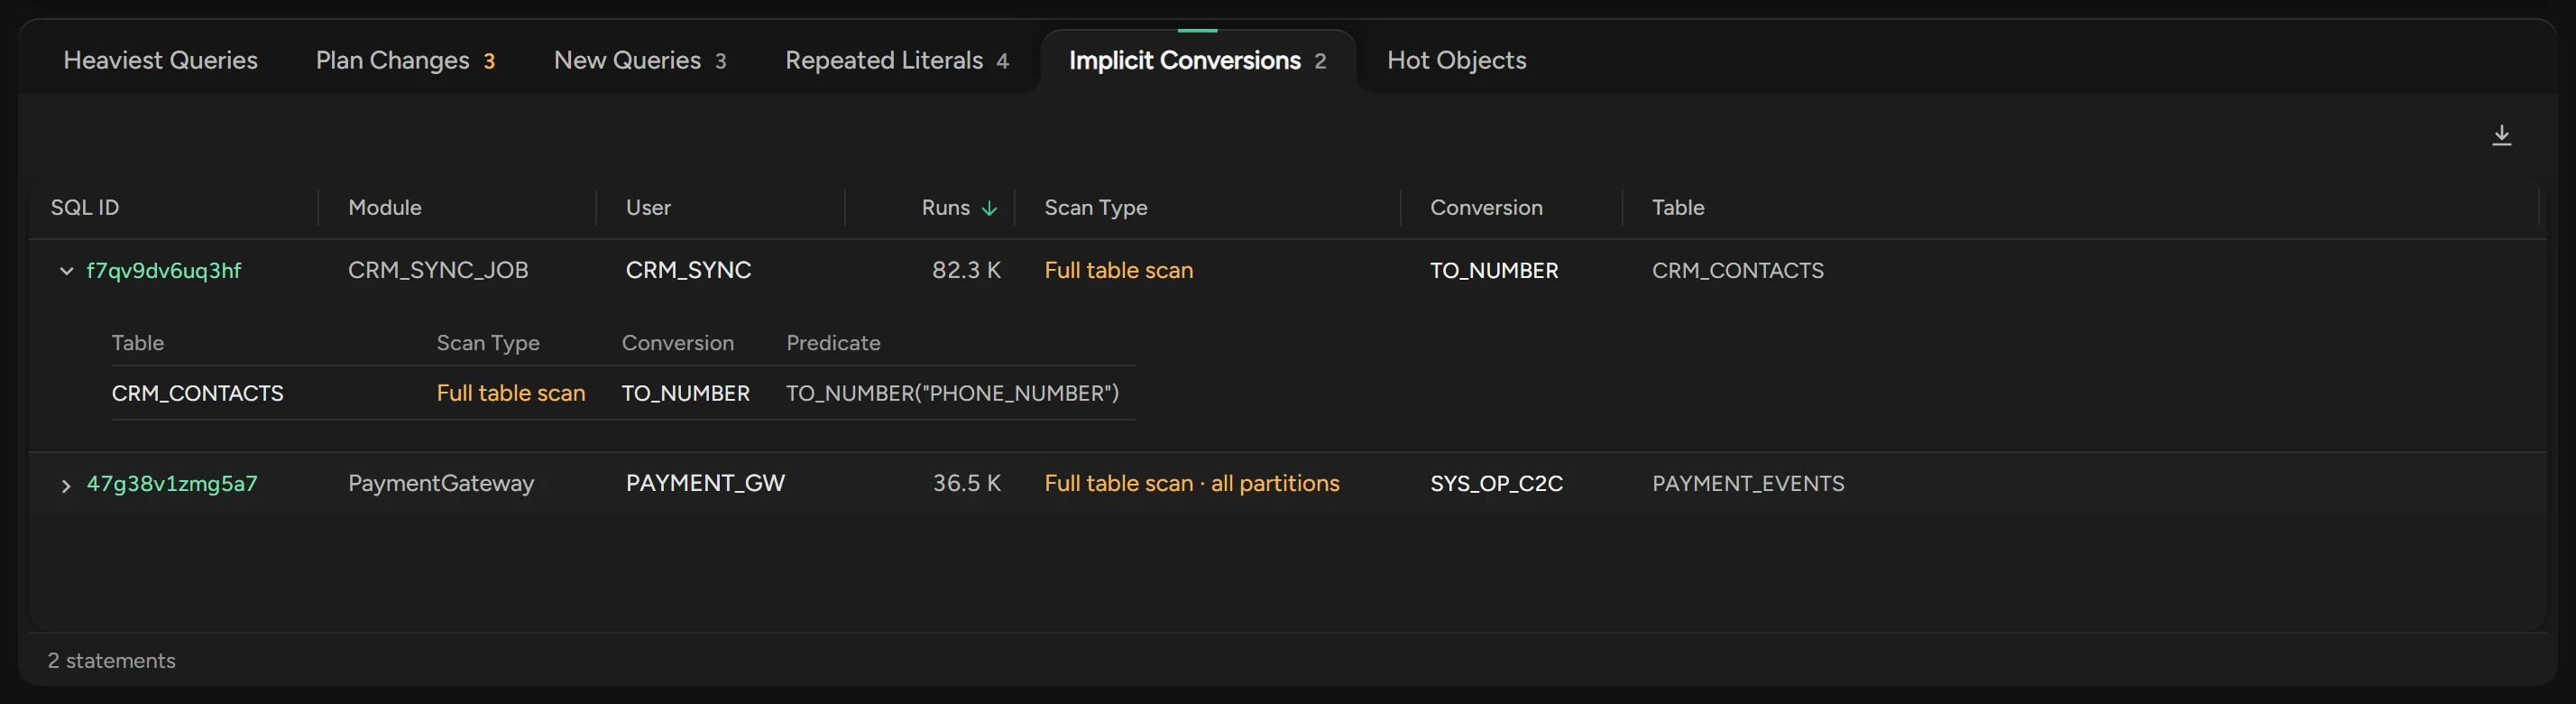
Implicit Conversions lists the statements whose plan converts a column, for example TO_NUMBER("PHONE_NUMBER"). Oracle then cannot use the index on the column.
Scan Type is amber for a full scan. Open a row to see the Predicate.
Find the busiest tables and indexes
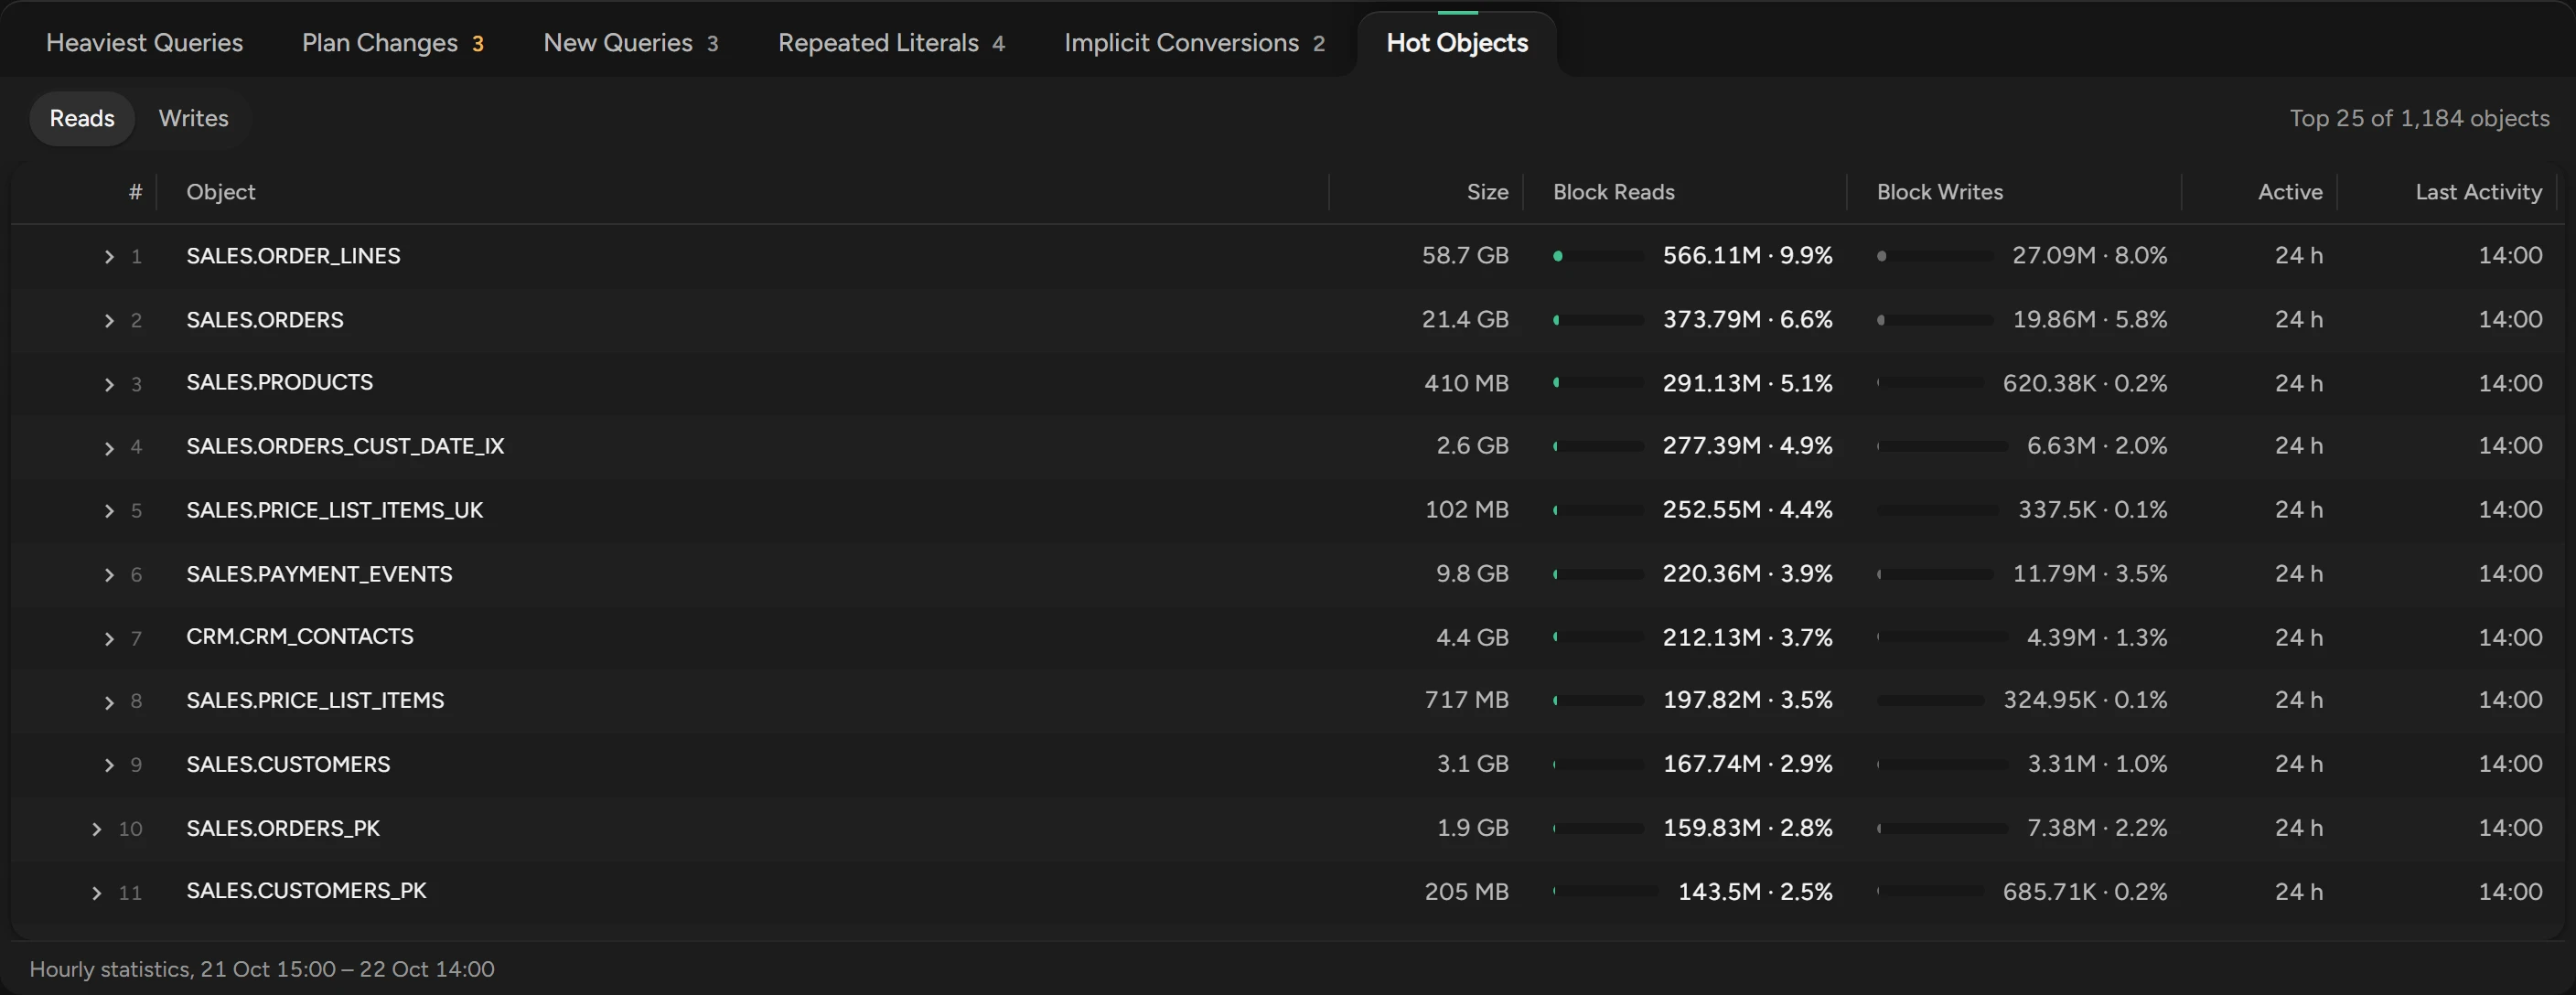
Hot Objects lists the 25 tables and indexes with the most block Reads or Writes. Open a row to list the statements that use the object.
With a user selected, the list shows only the objects of that schema. A module does not filter the list.
Export a list
To export the open list to Excel, click the download button. Hot Objects has no export.
Related
Updated October 29, 2026