Report policies
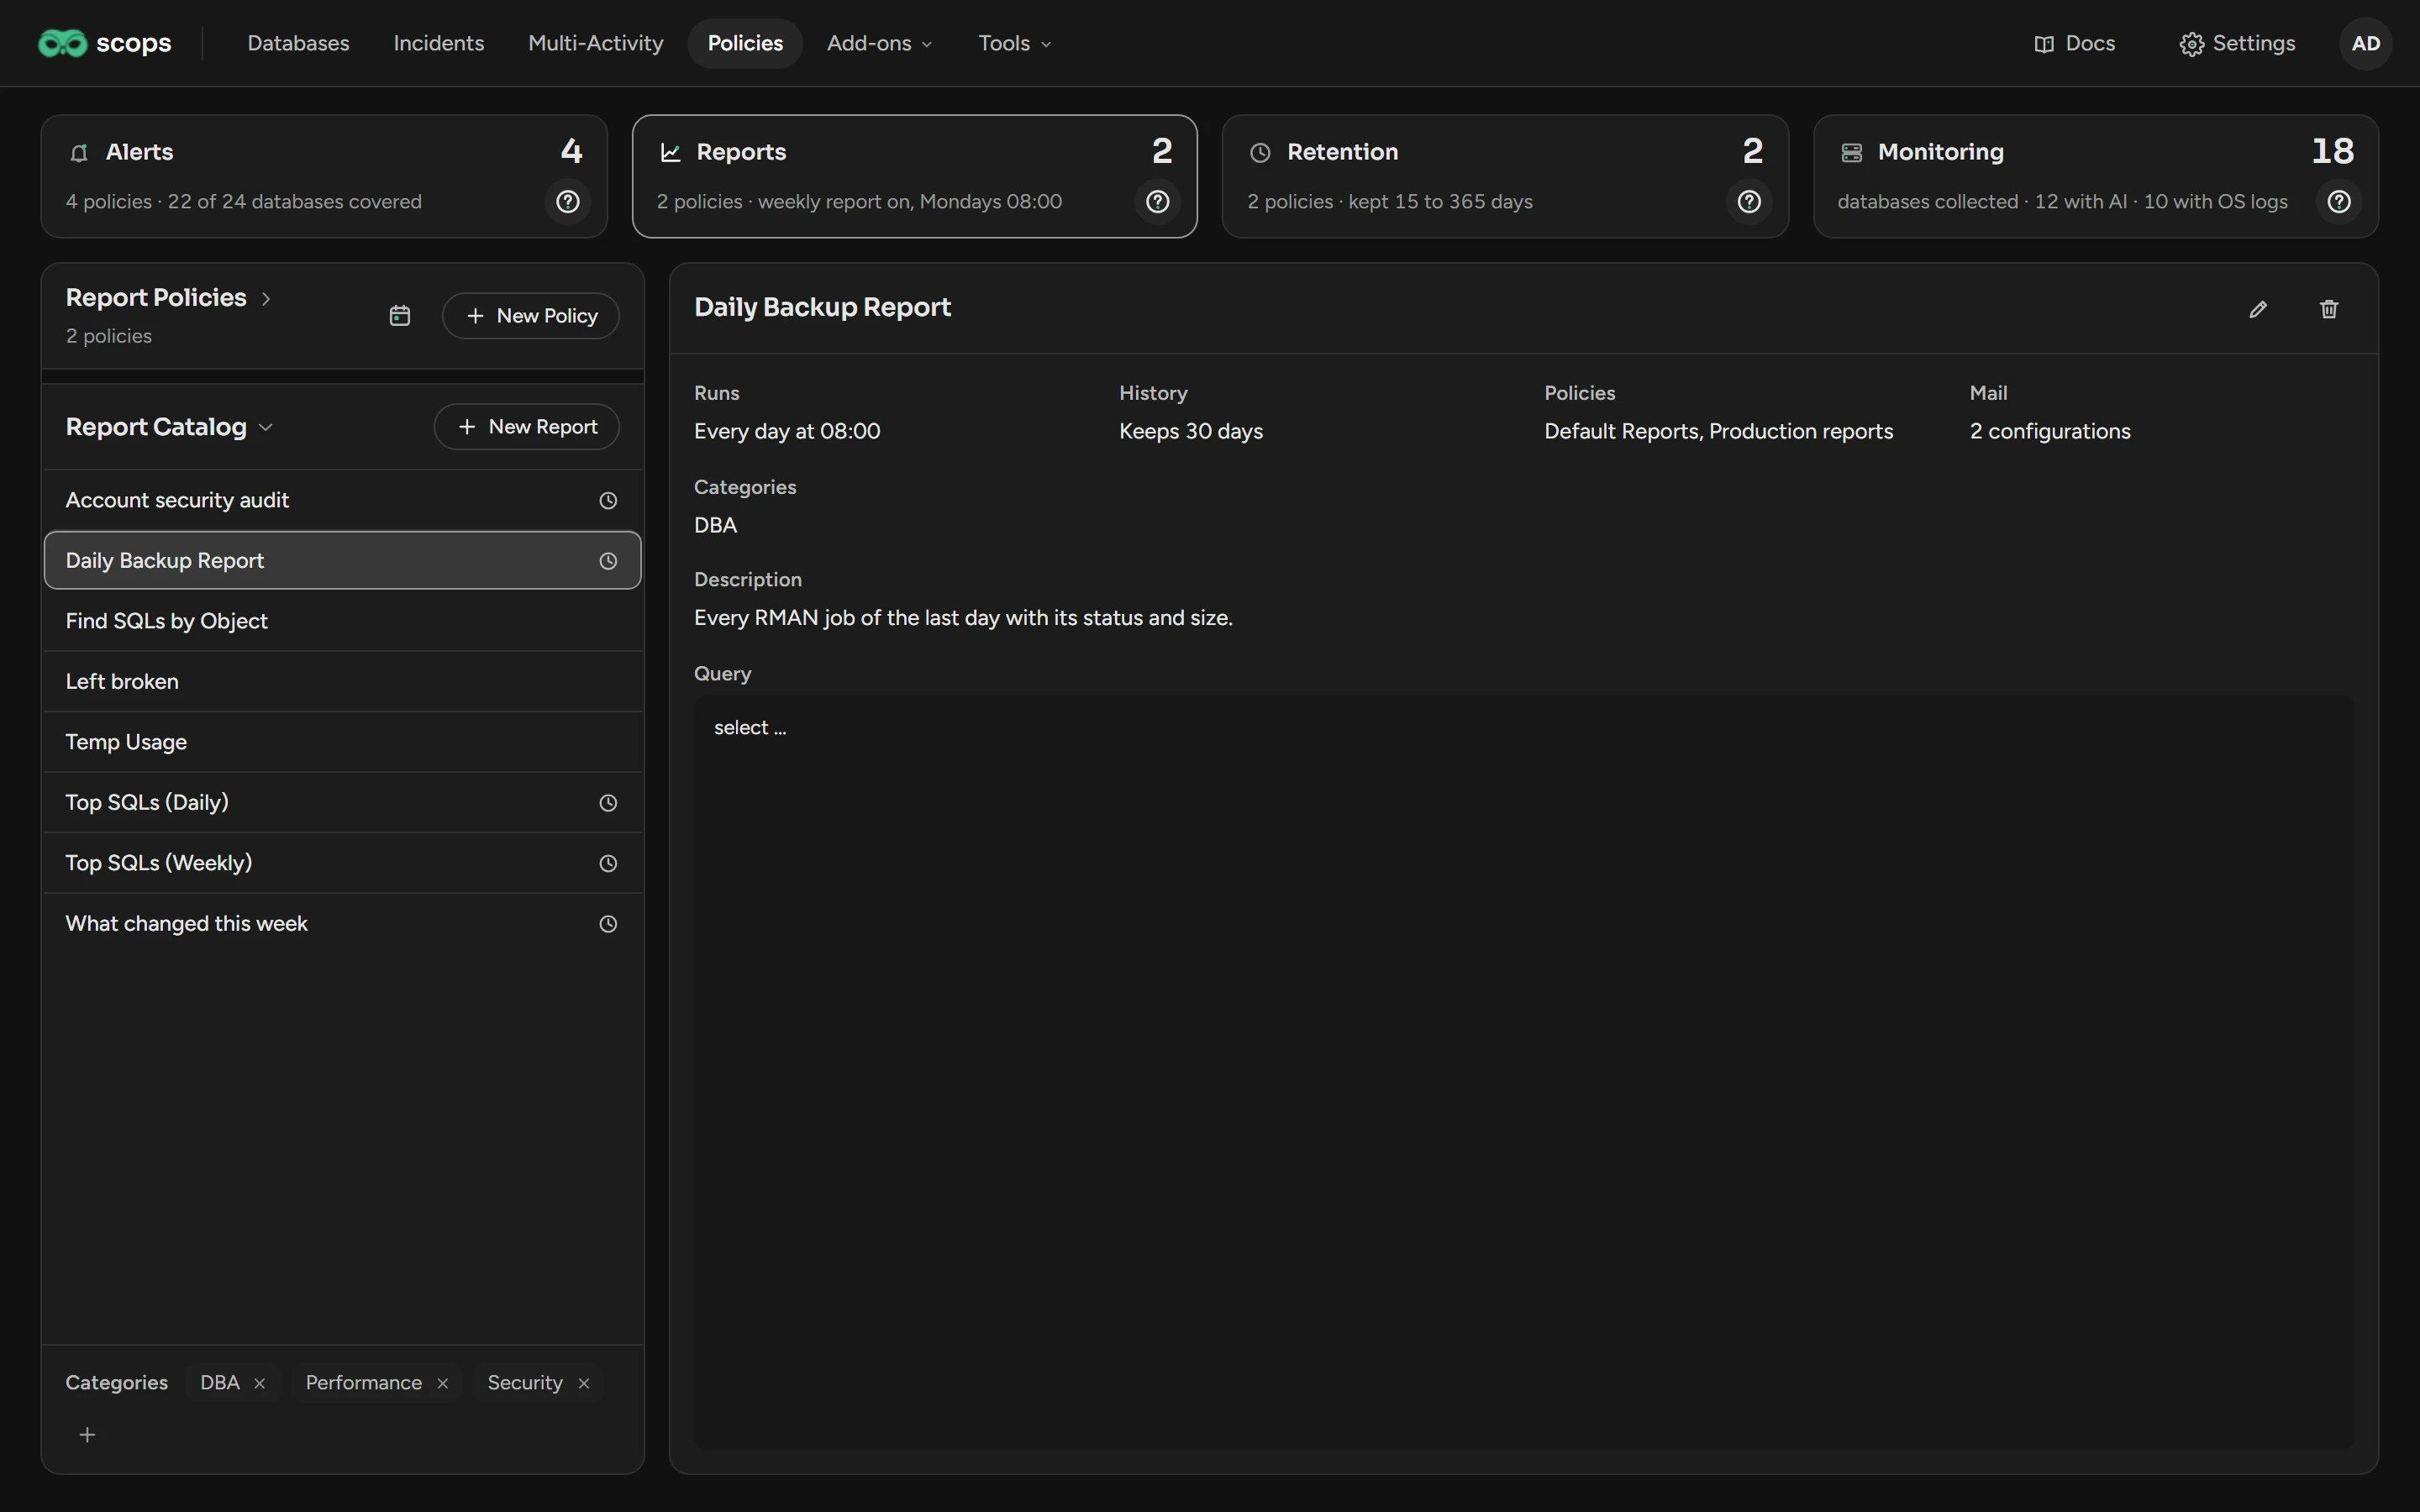
A report policy runs reports on a group of databases and mails the results. Open Policies › Reports.
Before you begin
- Report policies need Manage Policies. The Report Catalog needs Manage reports.
- Mail uses Settings › Email. See Email and notifications.
Create a report
Under the list of policies, click New Report.
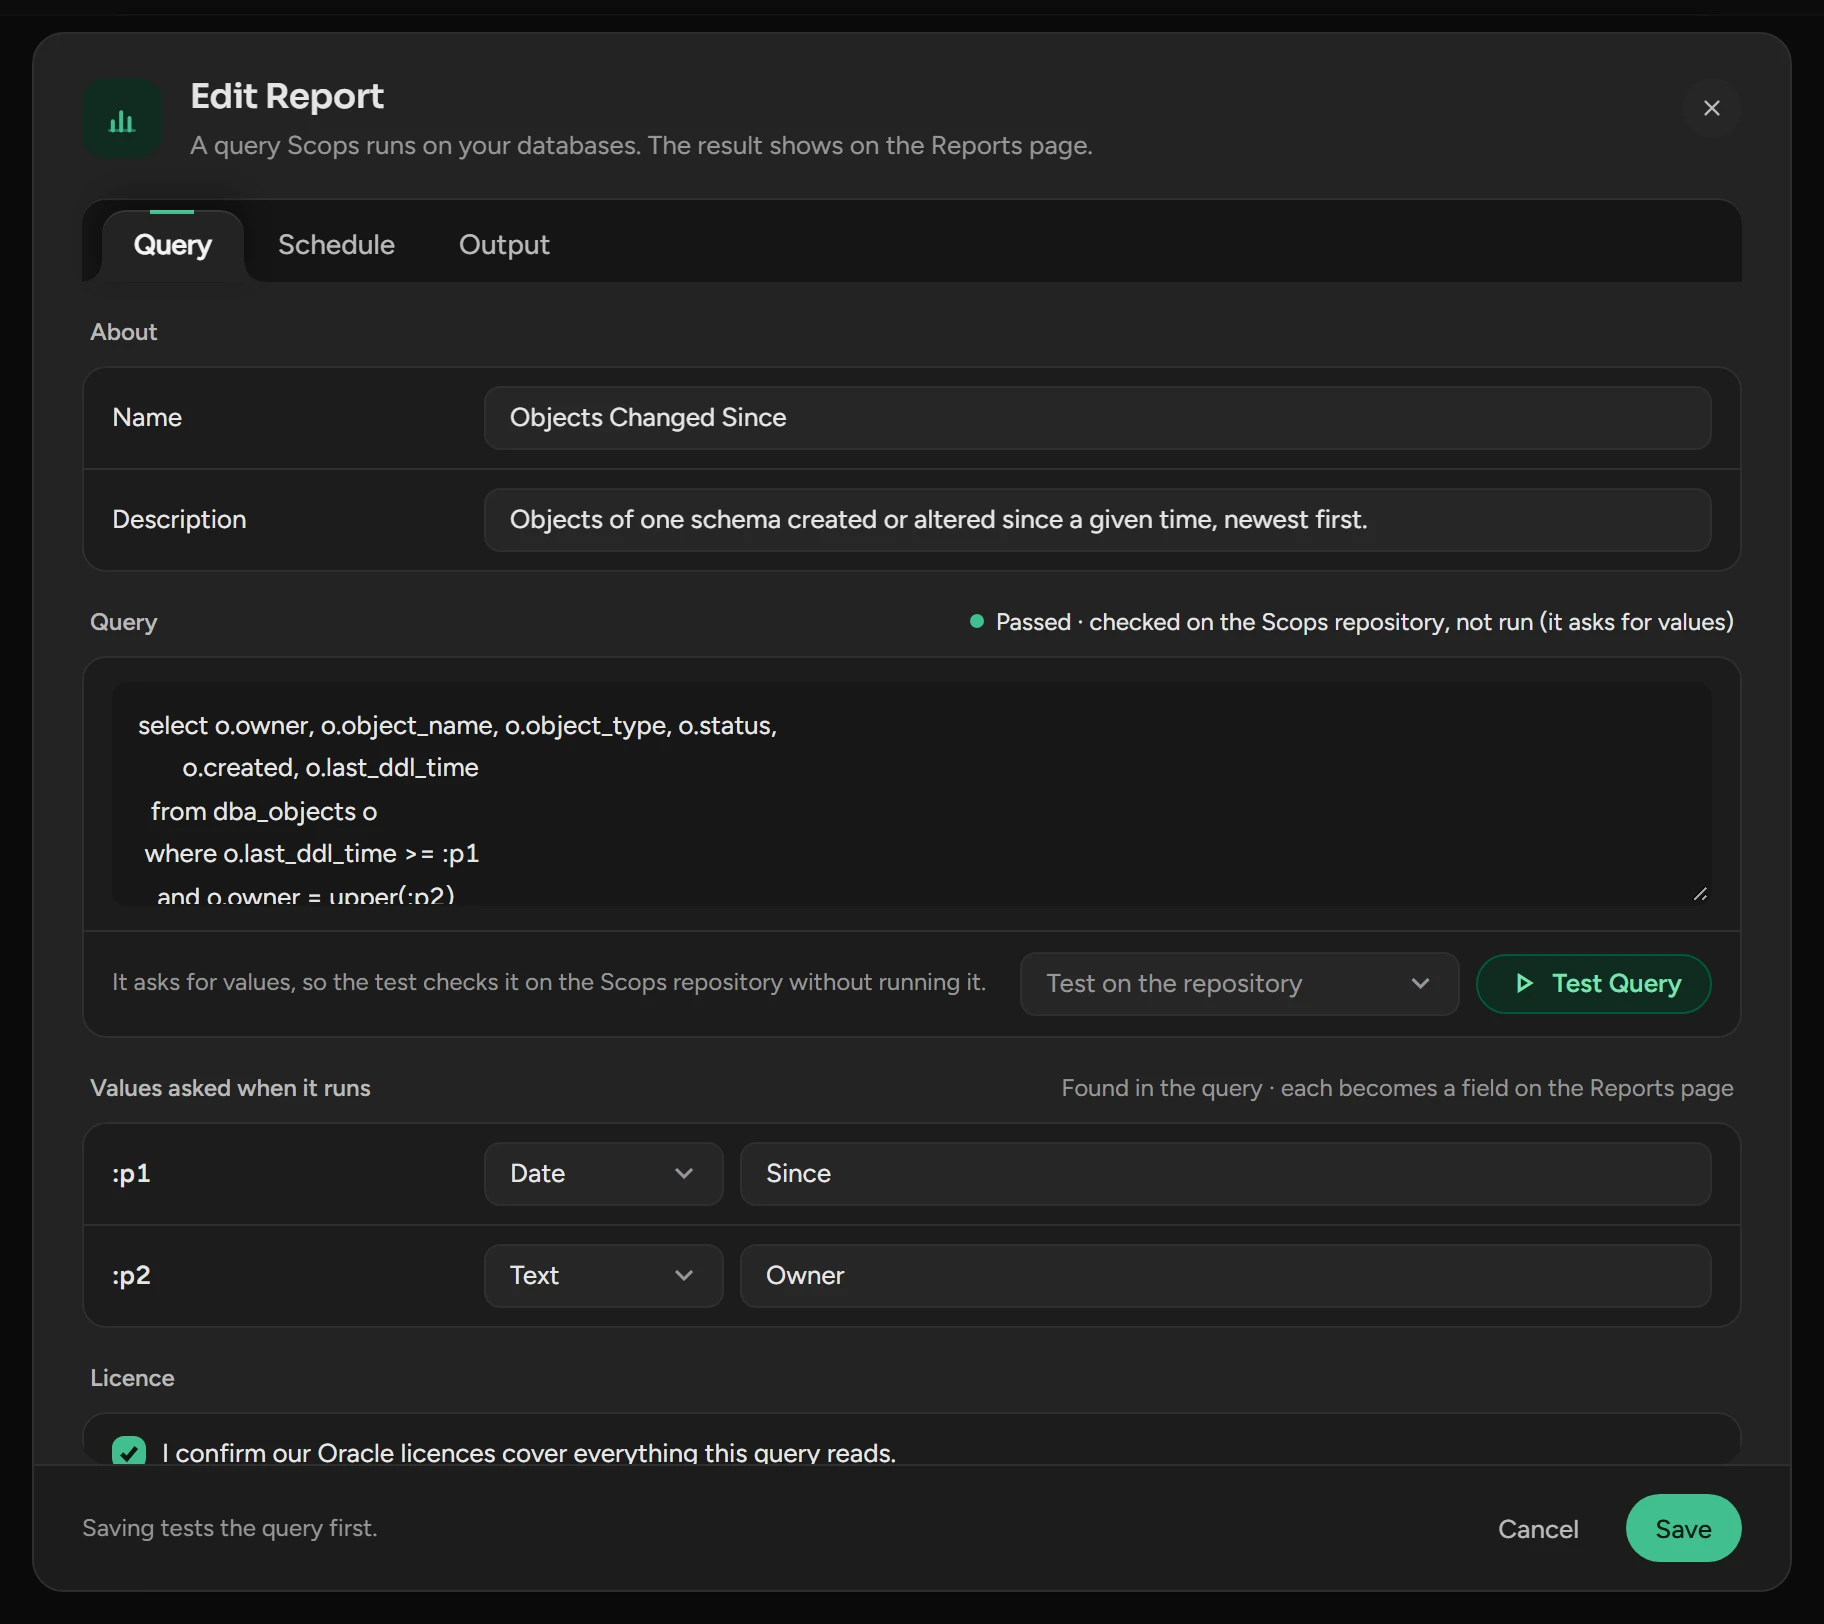
On Query, type a Name and a Description.
Write the Query. For values that the user gives, use
:p1to:p5.Select a database and click Test Query. The repository cannot read
DBA_andV$views.Tick I confirm our Oracle licenses cover everything this query reads.
Click Add Report. Scops saves the report only if the test passes. The report opens in the Report Catalog.
- The query is one SELECT, or WITH … SELECT. Scops refuses PL/SQL and statements that change data.
- Scops refuses Diagnostics and Tuning Pack sources:
DBA_HIST_views, active session history, ADDM, the advisors and SQL Monitor. - The monitoring account of each database must be able to read what the query reads.
- If you change only the schedule or the mail of a saved report, Scops does not test the query again.
To change a report, click Report Catalog under the list of policies. Click the report, then click its pencil.
Set when a report runs
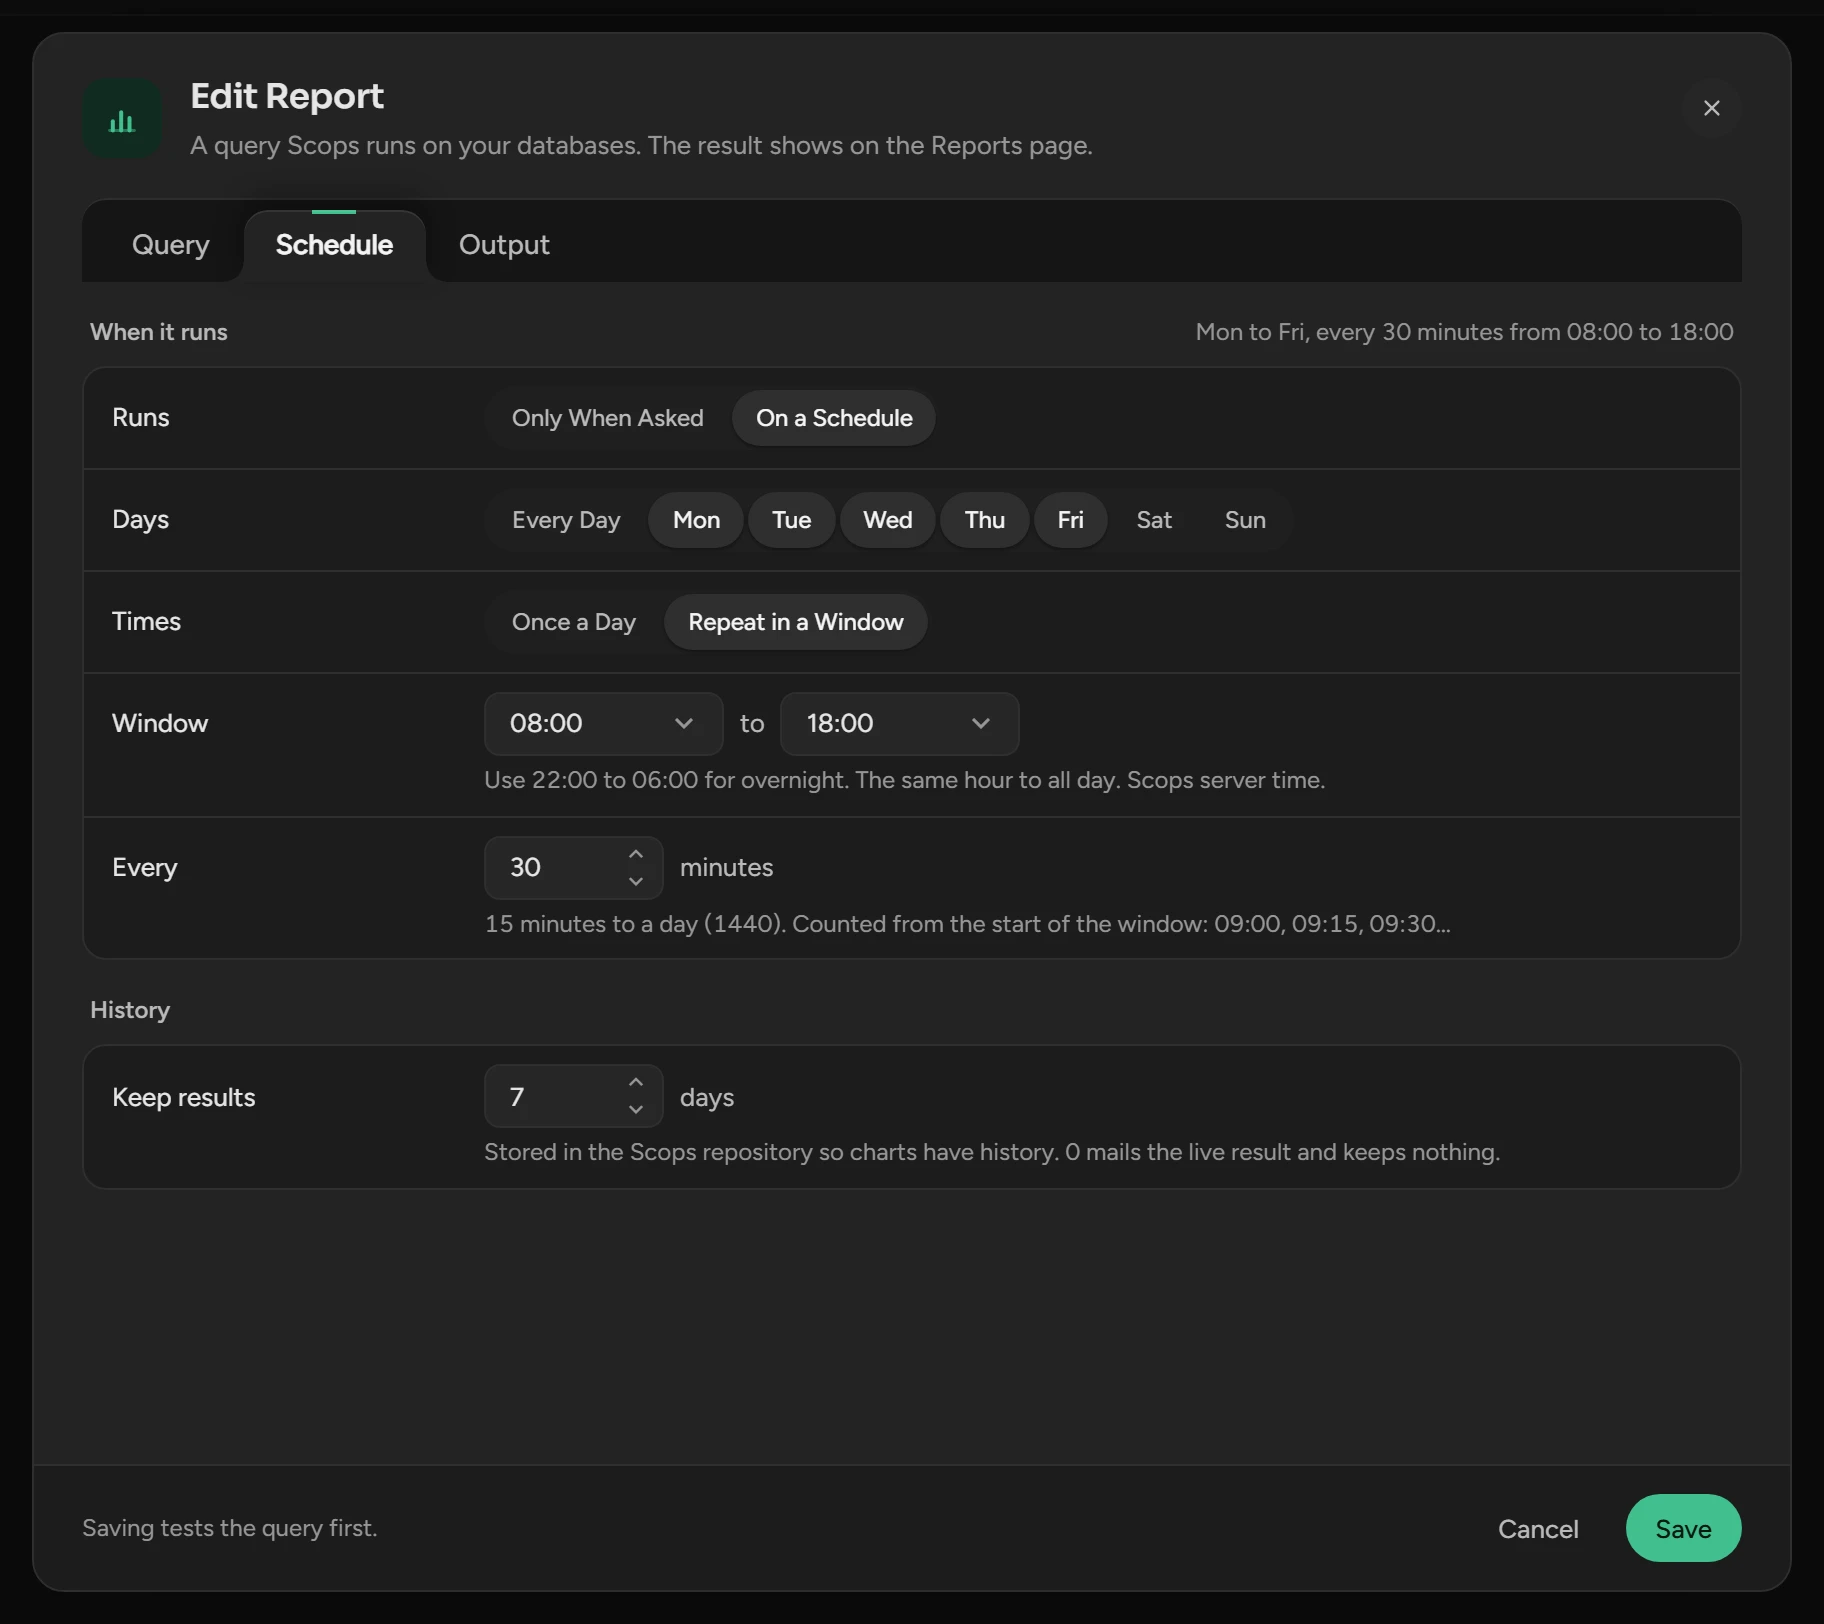
Open the Schedule tab of the report.
| Field | What it does |
|---|---|
| Runs | Only When Asked (the default) or On a Schedule. A report that asks for values runs only when asked. |
| Days | Every Day, or days of the week. |
| Times | Once a Day at an hour, or Repeat in a Window every 15 to 1440 minutes. |
| Keep results | Days to keep the rows of each run, 0 to 32, for charts. The query needs a SAMPLE_TIME column of type DATE. |
A scheduled report runs only on the databases of the running policies that hold it. Times use the clock of the Scops server.
Mail a report
Save the report. Then open its Output tab.
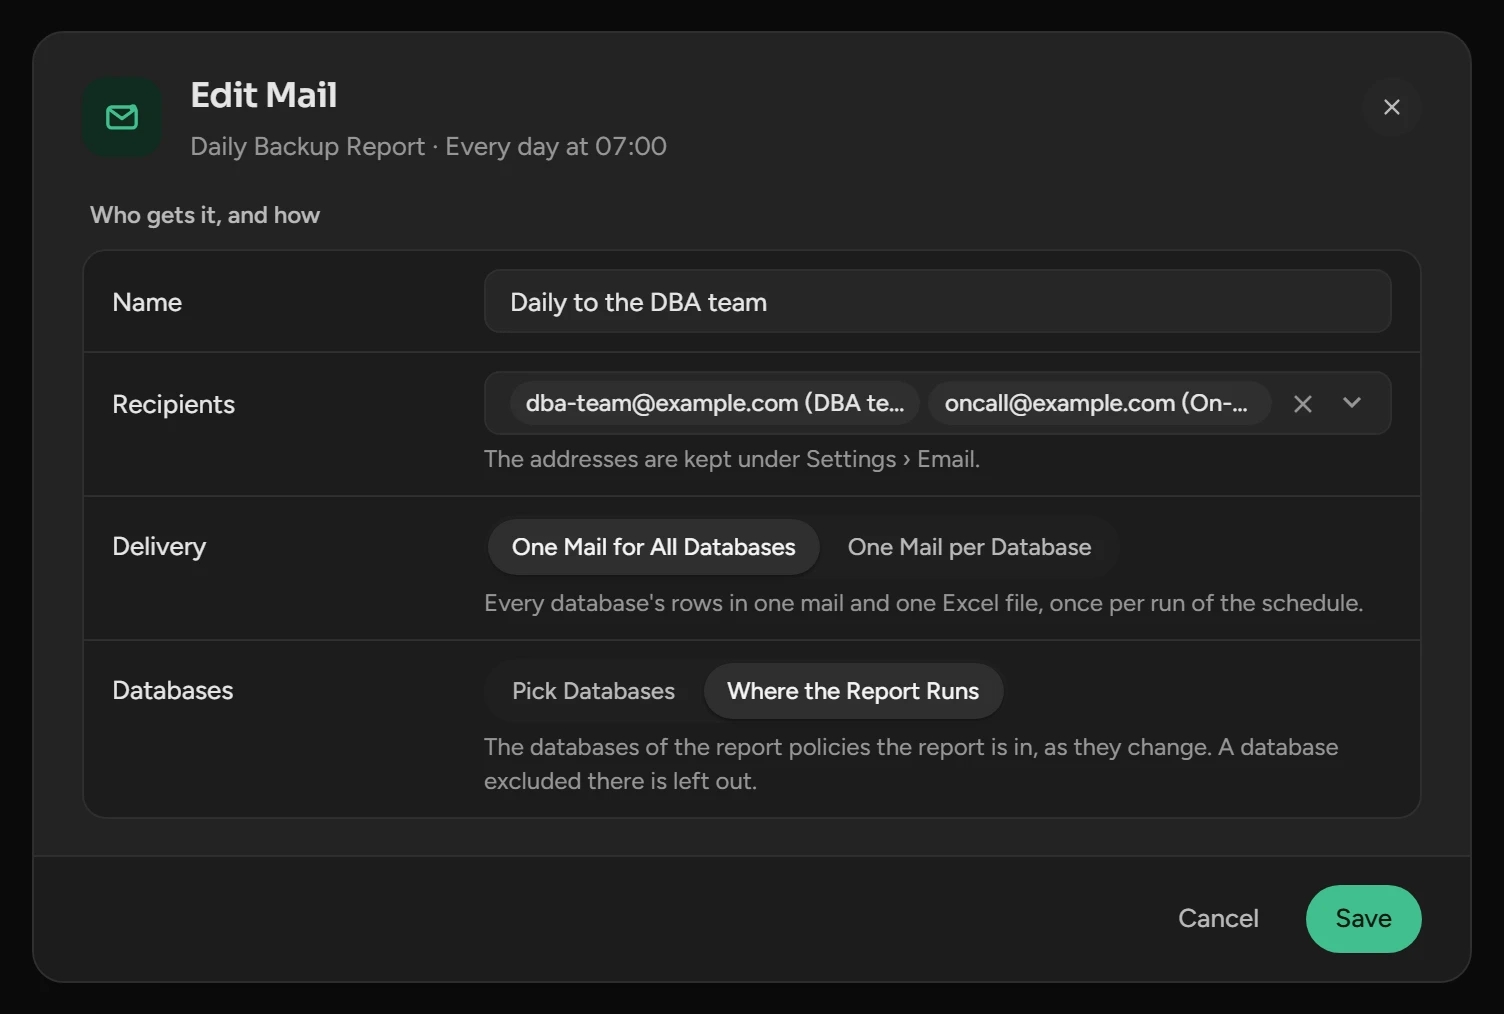
Click Add Mail.
Type a Name and select the Recipients.
Select the Delivery: One Mail for All Databases or One Mail per Database.
Select the Databases, then click Save.
The mail follows the schedule. It shows the first 250 rows, and the Excel file has all rows. A run with no rows sends no mail. The send button of a mail runs the report now and sends it.
On Output you can also set the Categories, Draw a chart and Colours in the mail.
Add a report to a policy
Click the policy in the list.
Click Add Report and select the report. If the report is not in the list, click New Report beside the search box. Scops selects the new report.
The Runs column shows when the report runs. The Excluded cell sets the databases that the report skips. The bin removes the report from the policy, but not from the catalog.
Create a report policy
Click New Policy.
Type a Name and click Create Policy.
Click its database count and select the databases. Click Save.
A new report policy has no reports. A database that you add leaves its old report policy.
Stop, rename or delete a policy
- Running switch: a stopped policy keeps its databases but runs no reports.
- Pencil: rename the policy.
- Bin: delete the policy. Its databases then have no report policy.
Delete a report
In the Report Catalog, click the report, then click its bin. The report leaves all policies. Scops deletes its mails and its kept results.
Manage categories
At the bottom of the Report Catalog, + adds a category and × deletes one. The Reports page lists the reports by category.
Weekly performance report
One mail for each database every week: its health, a Scops AI summary and eight daily charts. The settings are one set for all policies.
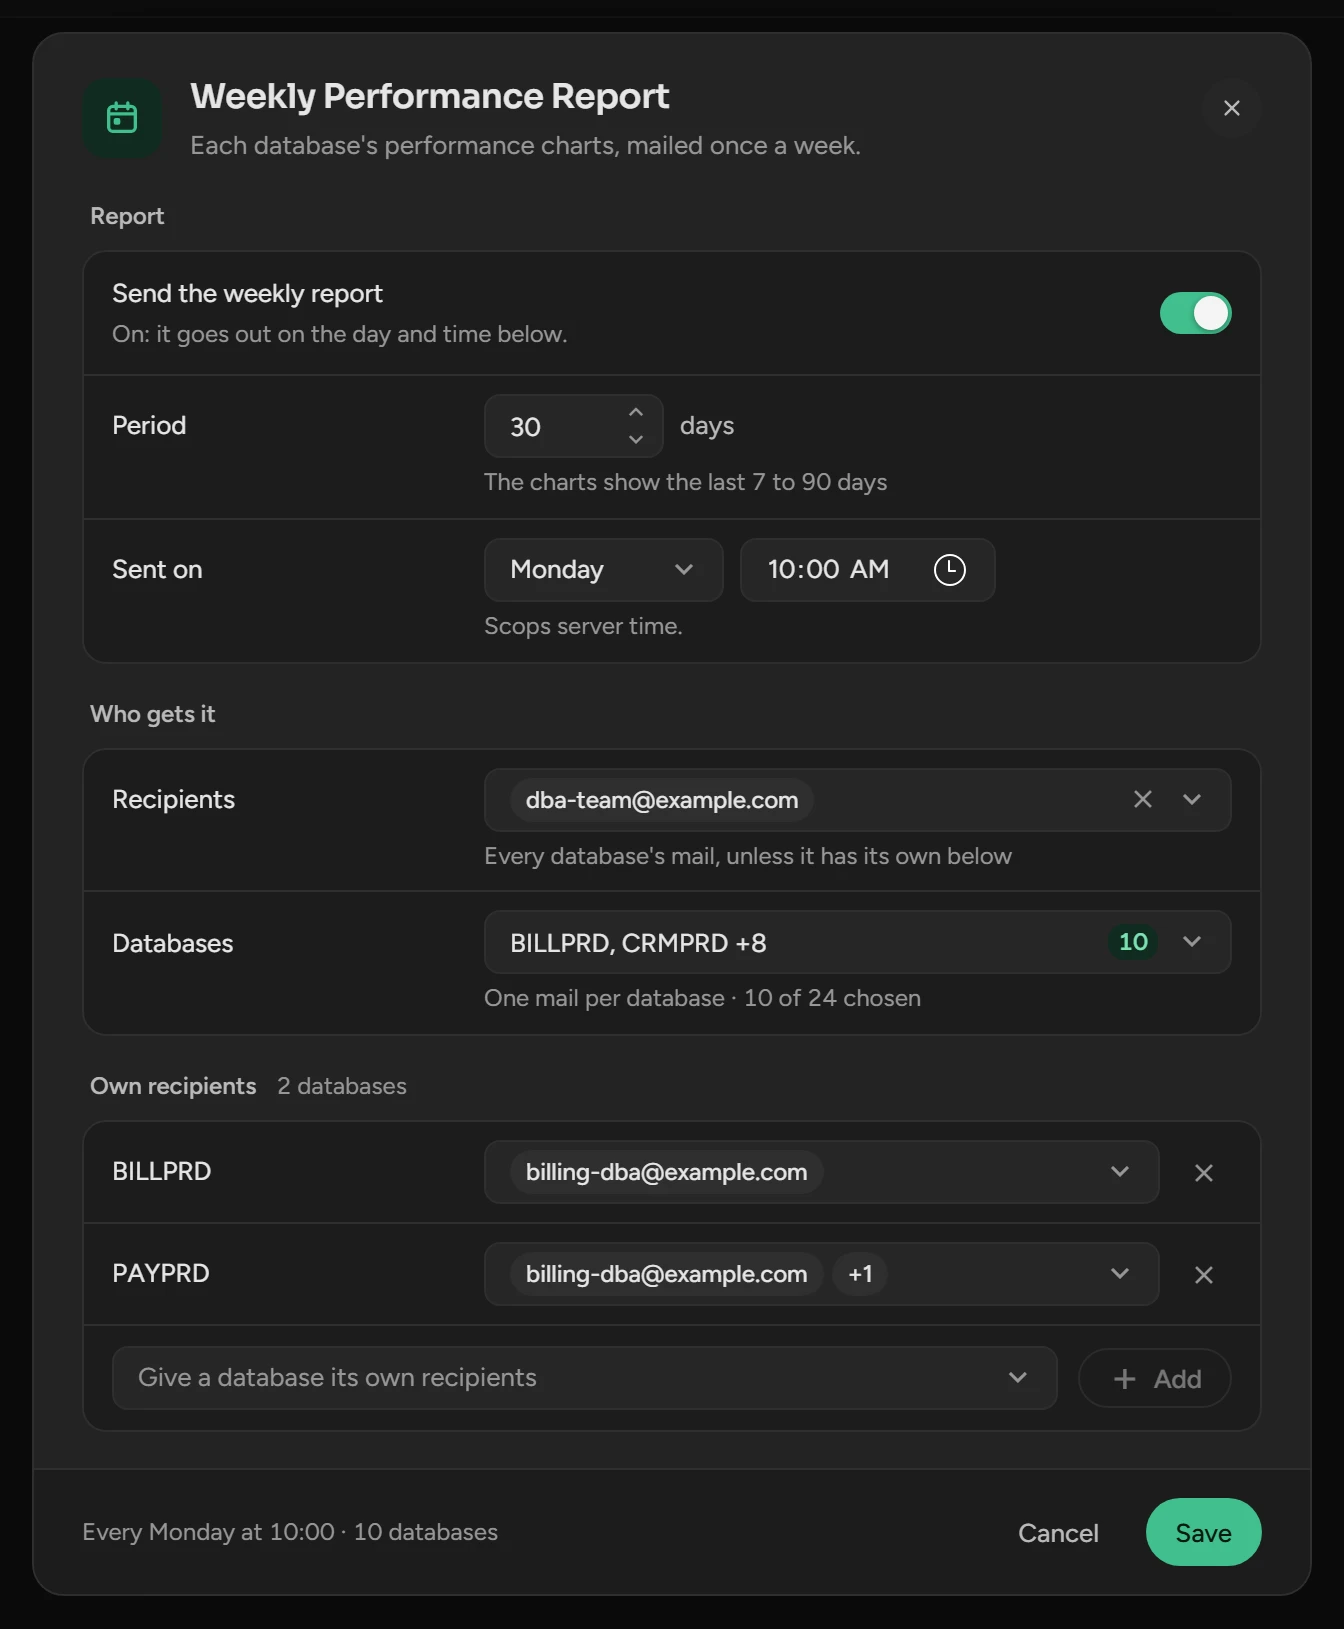
Click the calendar button above the list, Weekly report settings.
Turn on Send the weekly report.
Set the fields in the table below.
Click Save.
| Field | What it does | Default |
|---|---|---|
| Period | The days that the charts show. | 30 days (7 to 90) |
| Sent on | The day and time, on the clock of the Scops server. | Monday, 10:00 |
| Recipients | Who gets the mail. | None |
| Databases | The databases that get a mail. | None |
| Own recipients | Other recipients for some databases. Click Add. | None |
What the mail holds
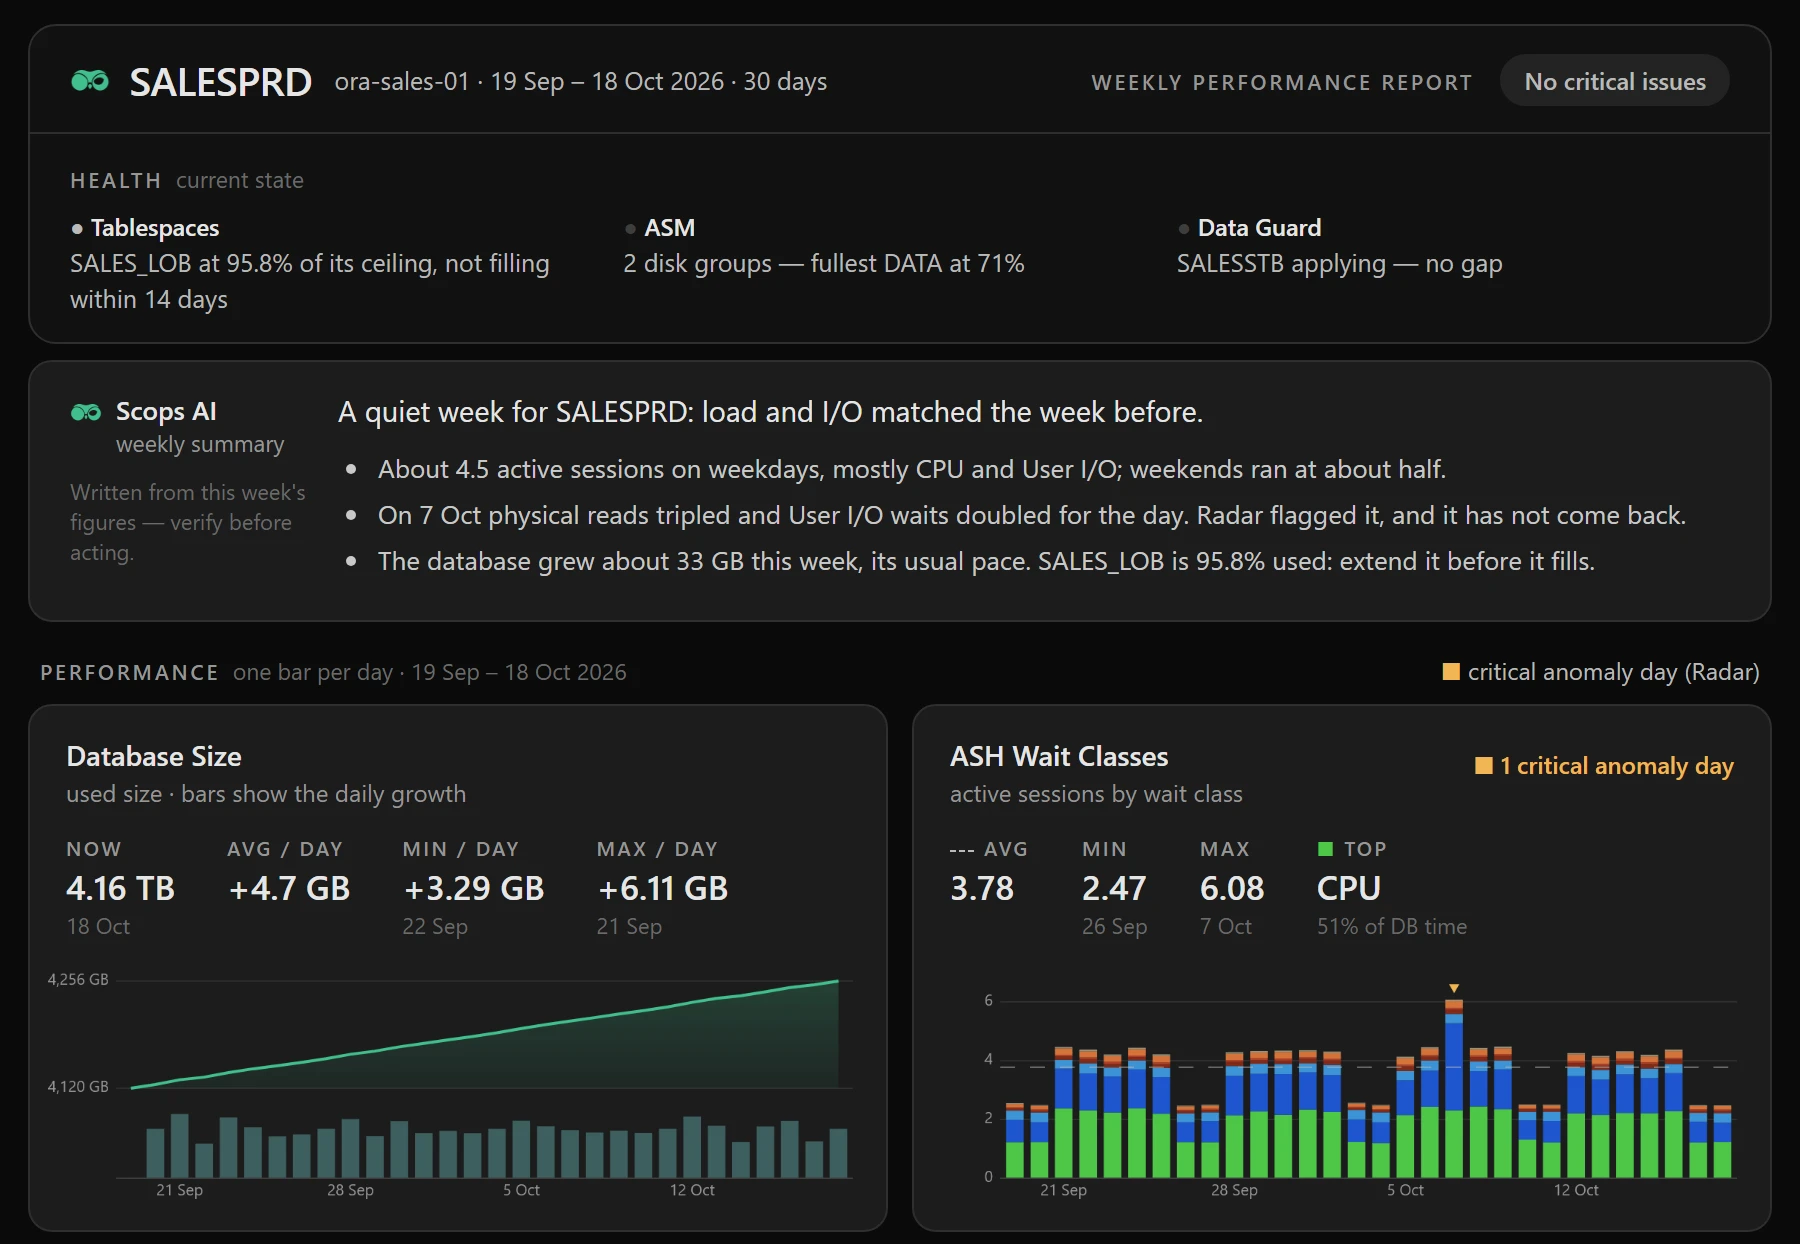
| Part | What it shows |
|---|---|
| Health | Tablespaces, ASM and Data Guard, the most urgent first. |
| Scops AI weekly summary | The week compared with the week before. It needs Scops AI. |
| Performance | Eight charts with a bar for each day. A day with a critical anomaly is orange. |
The report sends no query to the database. It uses the data that Scops collected.
Related
Updated October 30, 2026