Metrics
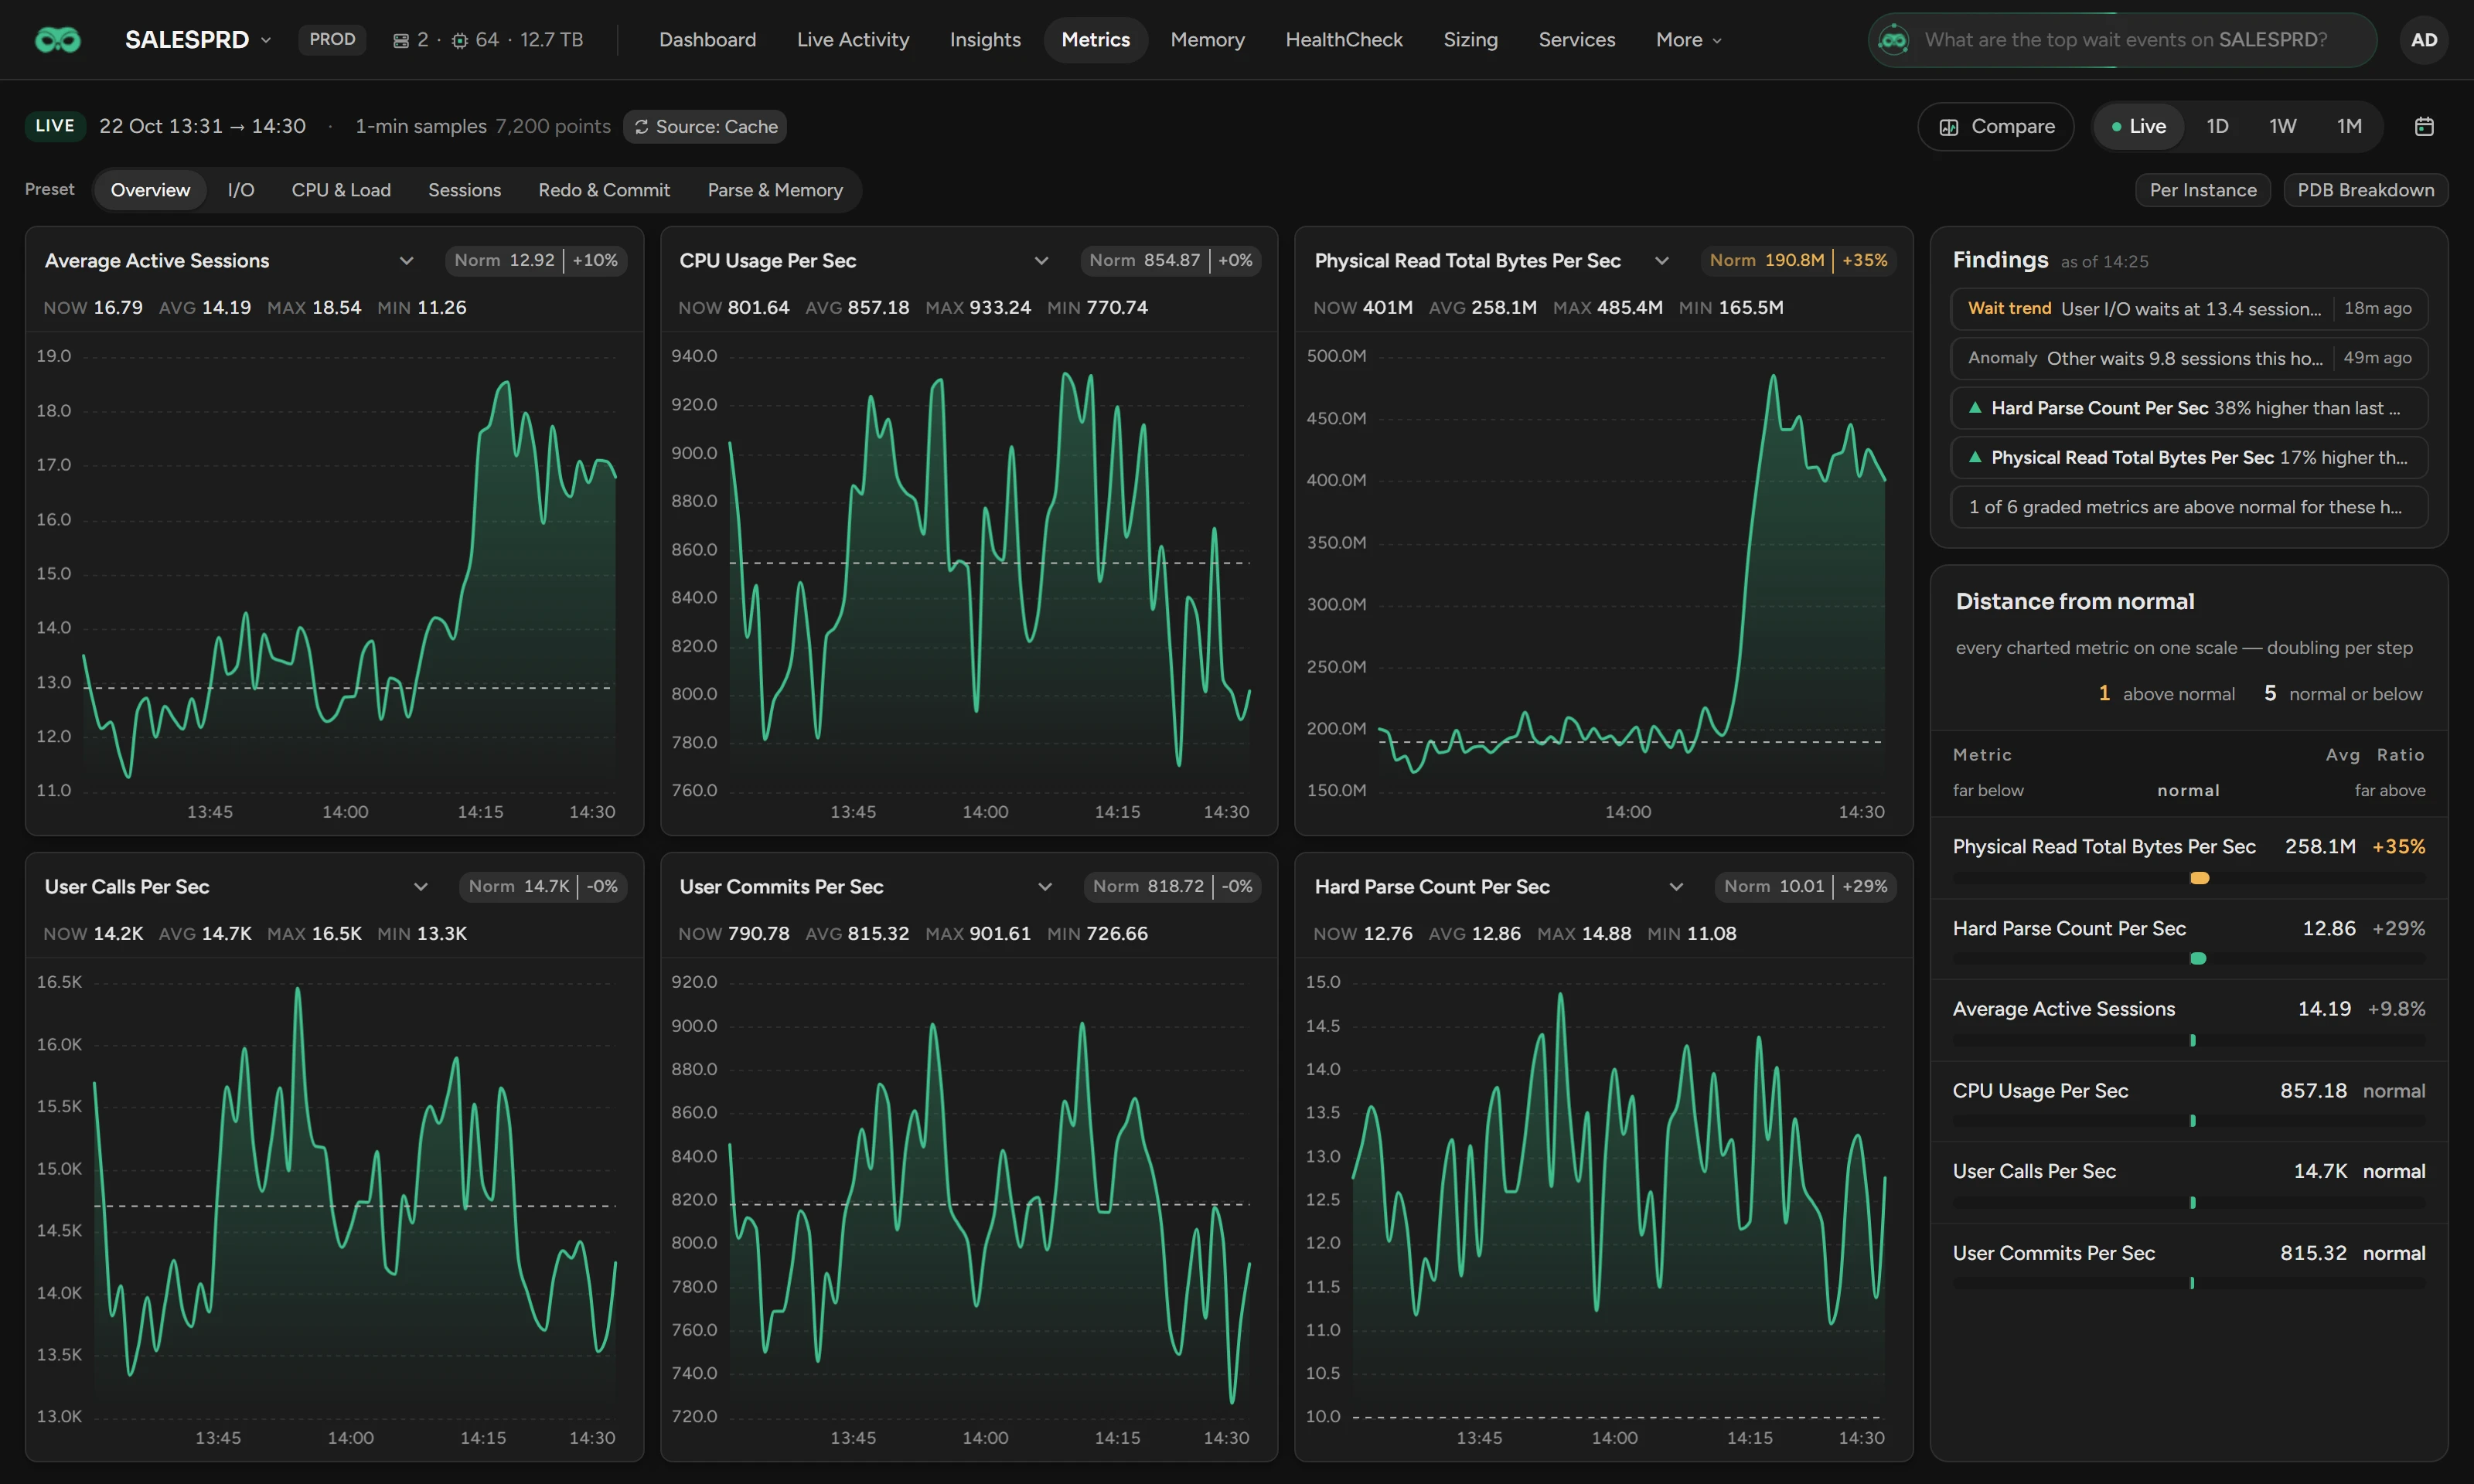
Use Metrics to read the Oracle system metrics of one database, six charts at a time, each against its normal for those hours.
Before you begin
- You need the View Metrics permission. Metrics needs no Oracle pack.
- Scops keeps the one-minute metrics for 90 days by default, 15 days in the Community edition (see Retention).
Choose the window
| Button | Window |
|---|---|
| Live | The last hour. The page refreshes every minute. |
| 1D, 1W, 1M | The last 24 hours, 7 days or 31 days. |
| Calendar button | Up to 31 days. Select From and to, then click Apply. |
A window longer than 4 hours shows bars. To zoom in, click an hourly, 4-hour or daily bar.
Pick the metrics
Select a Preset: Overview (the default), I/O, CPU & Load, Sessions, Redo & Commit or Parse & Memory.
To change one chart, click its title and select a metric.
On RAC, turn on Per Instance for one series per instance. Else a chart shows the Total, or the Average for a ratio, a percentage or a time.
On a container database, turn on PDB Breakdown for one series per pluggable database.
Read a chart
NOW is the newest point, and AVG, MAX and MIN are for the window. These four numbers show the combined value, also with Per Instance or PDB Breakdown on: the total, or the average for a ratio, a percentage or a time. The dashed line is the normal: the usual value at that hour in the history of this database, for weekdays and weekends apart.
| Badge, for example Norm 190.8M | +35% | Meaning |
|---|---|
| Amber | The window average is more than 3.5 standard deviations above normal, the same test as Radar Engine. |
| Red | Twice that distance above normal. |
| No color | Normal, or below normal. |
| A dash | No grade: a window shorter than 45 minutes, Per Instance on, or too little history. The tooltip gives the reason. |
A grade needs about ten days of history for weekday hours and three weeks for weekend hours. With PDB Breakdown on, the charts have no badge.
Find what is far from normal
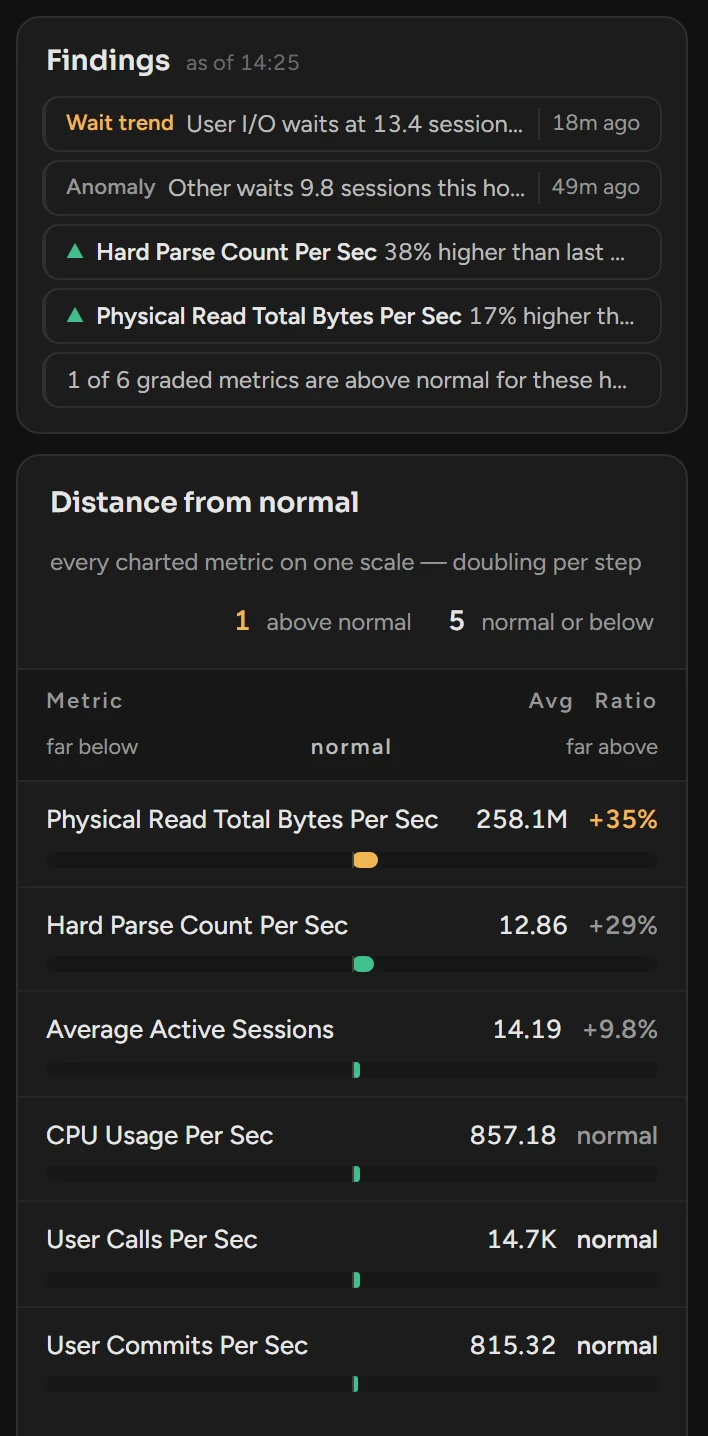
- Findings shows the open Radar findings of the kind Anomaly or Wait trend. It also shows the metrics that changed by 15% or more against last week, and the count above normal.
- Distance from normal ranks the charted metrics by their Ratio to normal, for example +35% or −40%. A bar goes right above normal and left below, in the color of the badge.
Compare two ranges
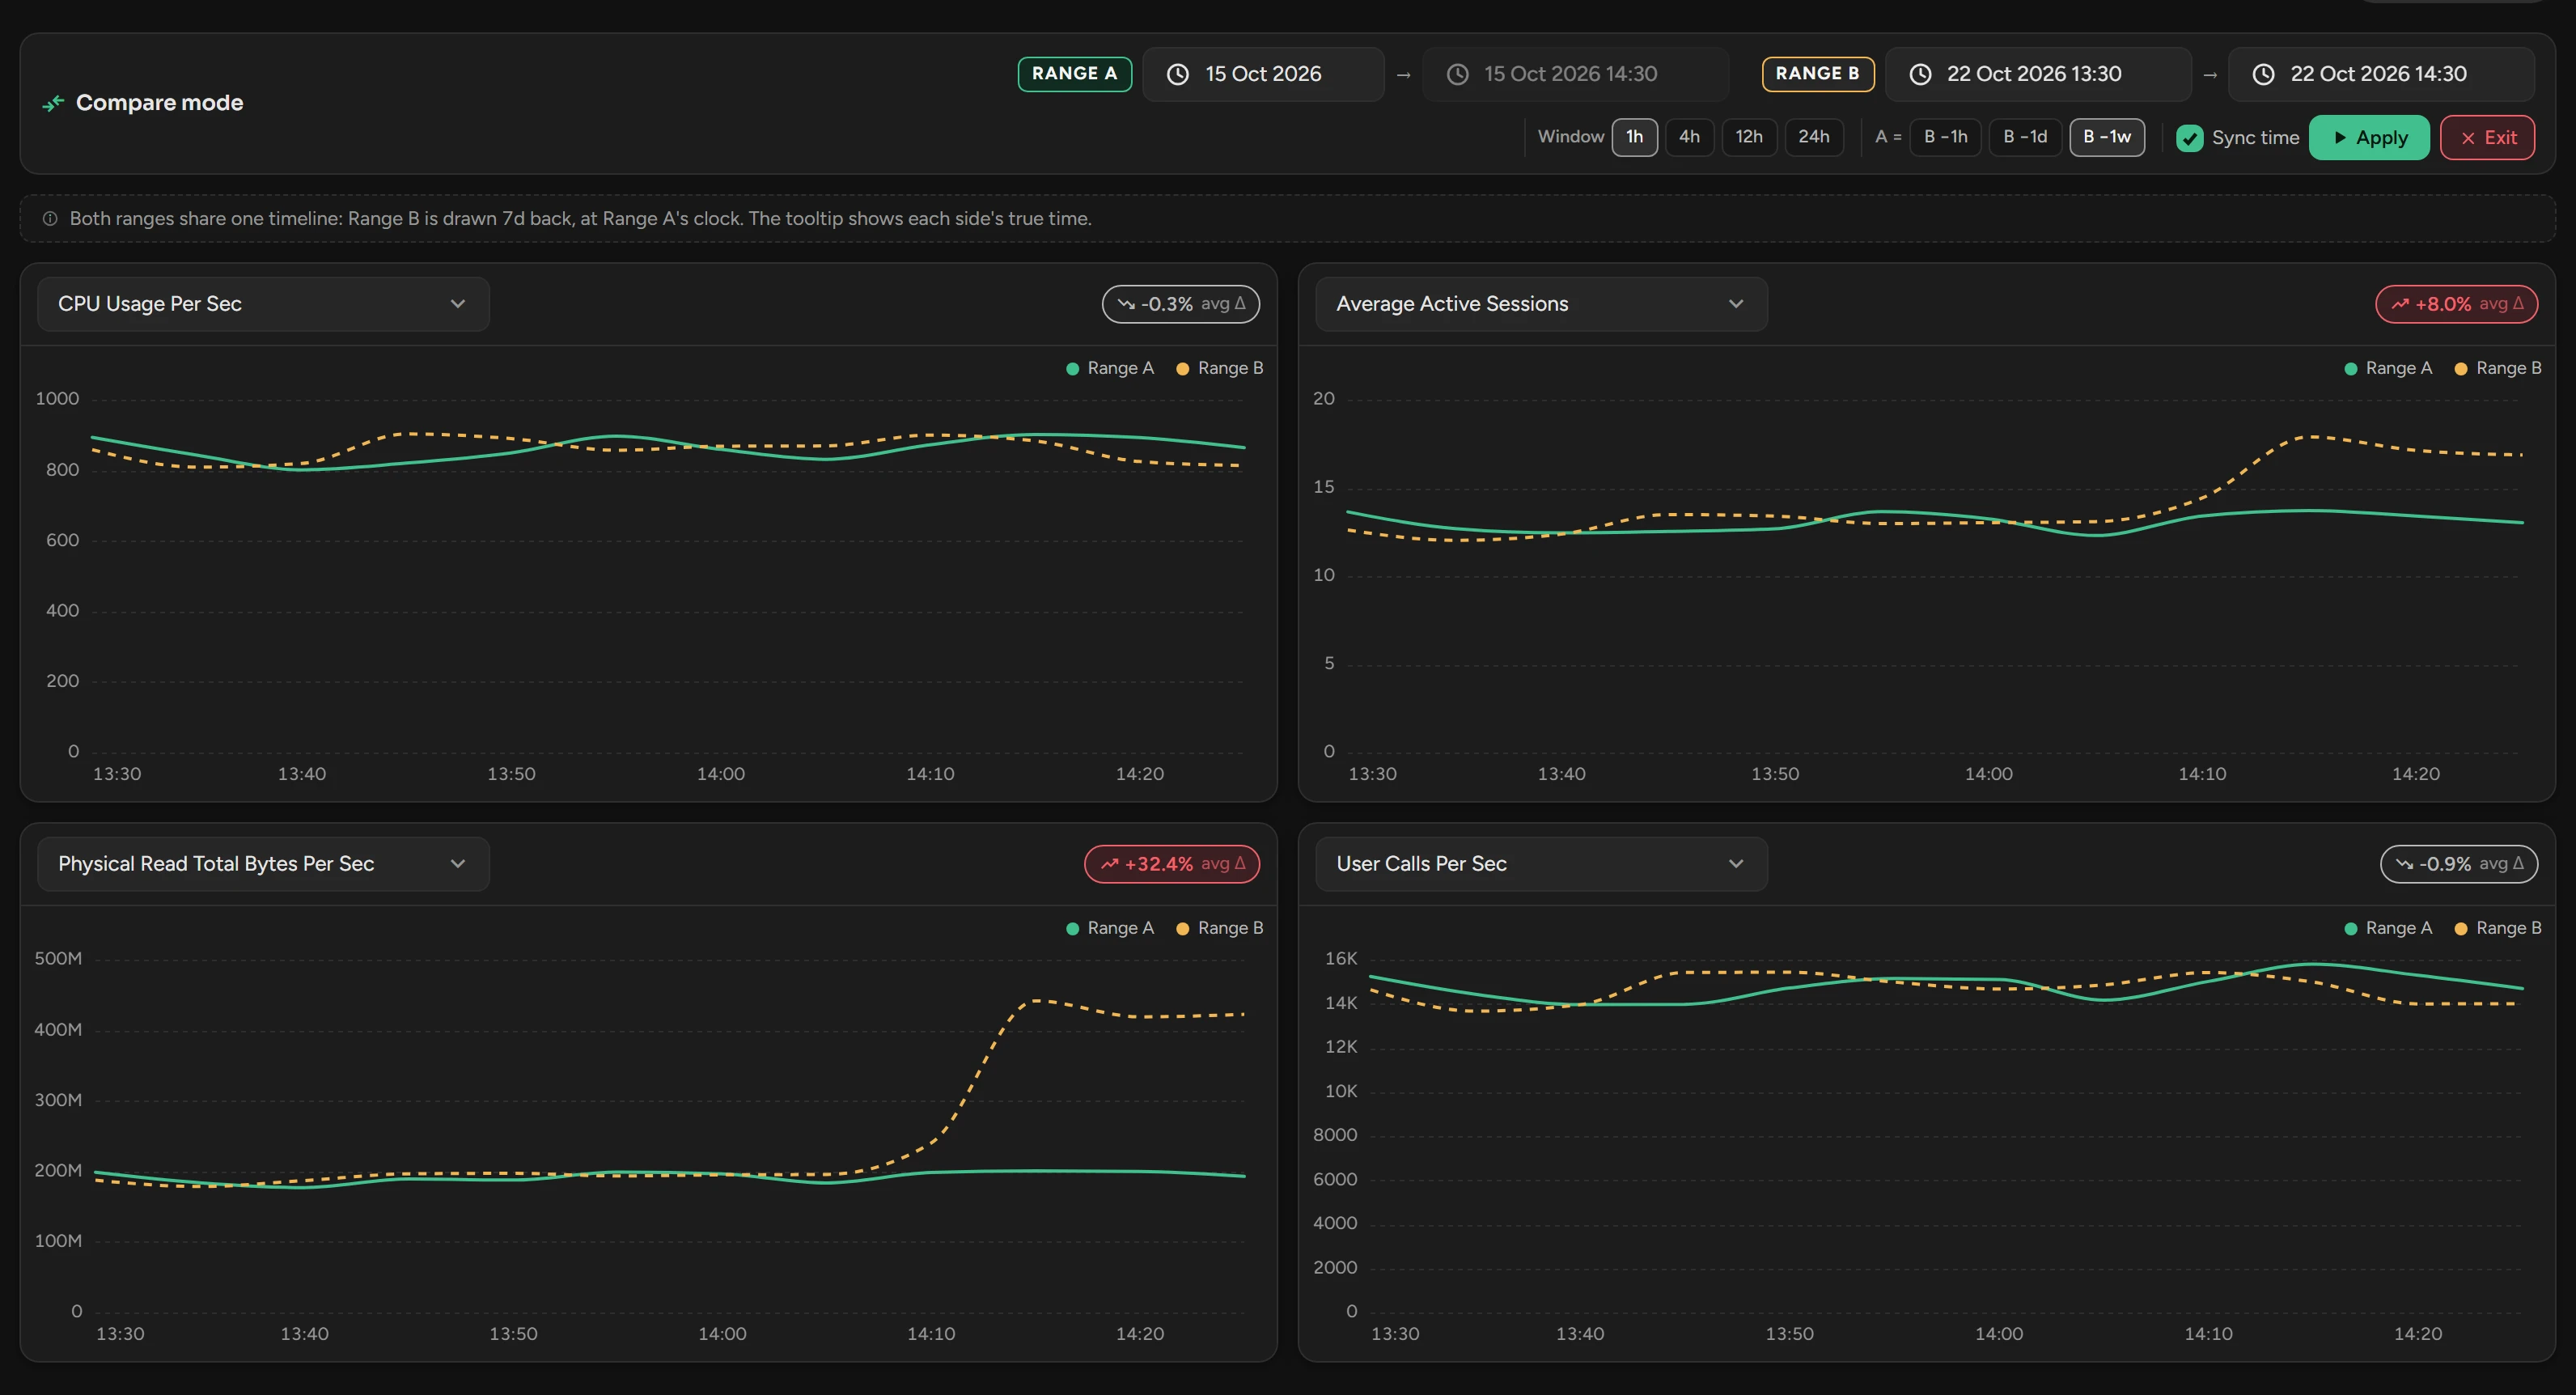
Click Compare. Four charts open. Range B is the last hour, and Range A is the same hour one week before.
Select a metric for each chart.
Set the ranges with Window, A = and Sync time, as on the Dashboard. If you changed a date, click Apply.
To go back to the six charts, click Exit or Exit Compare.
Range A is a solid line and Range B is dashed. The badge on each chart is the change of the average from A to B.
Related
Updated November 2, 2026