Overview
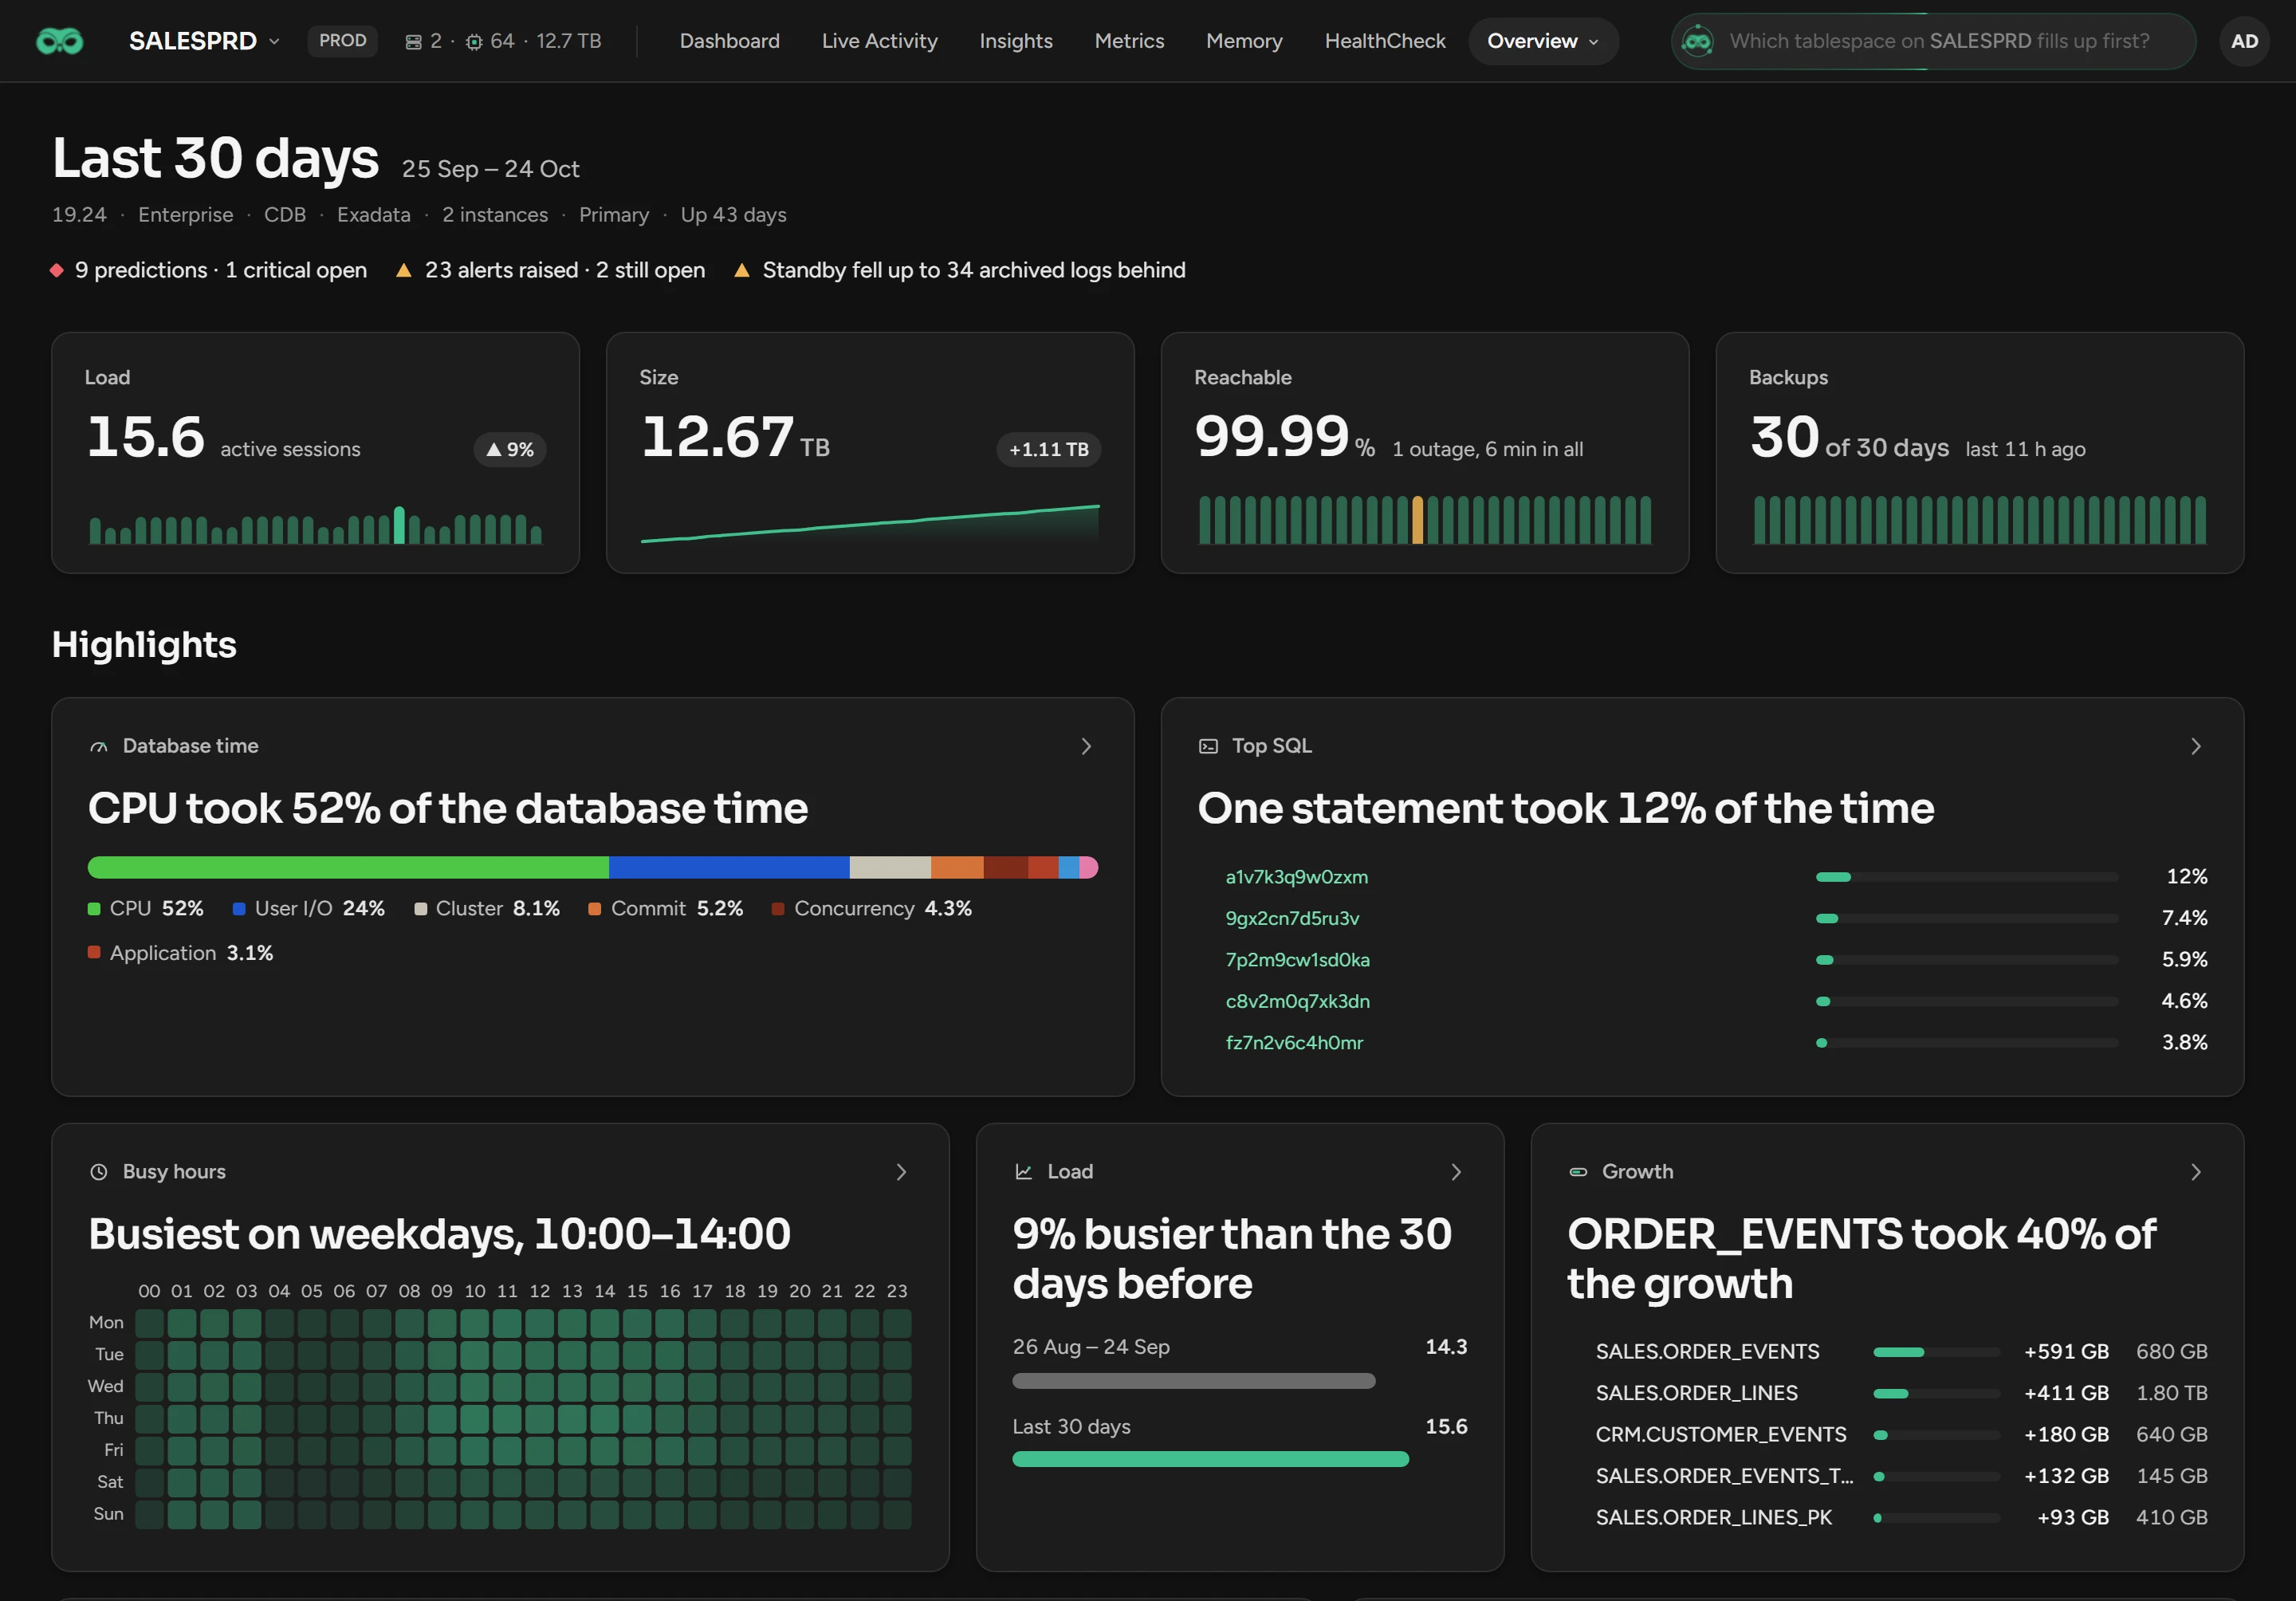
Use Overview to read the last 30 days of one database: its load, growth, availability and backups.
Before you begin
- You need the View Overview permission.
- The page shows the last 30 full days, up to yesterday, with no time controls. The Page Cache job on the Jobs page prepares it every hour.
Read the top of the page
A line of facts shows the release, edition, CDB or PDB, Exadata, instances, Data Guard role and uptime. When something needs attention, such as a Radar prediction or a standby that fell behind, the next line shows it. Click it to open What Happened.
Read the vitals
| Vital | What it shows |
|---|---|
| Load | The average active sessions, the change from the 30 days before, and a bar for each day. |
| Size | The used size on the last day, and its growth. |
| Reachable | The share of the time that the database was available, with outages (amber days) and restarts. It needs the DB Access alert in the alert policy. Without it, the vital is Uptime. A database added today has no figure until its first complete day. |
| Backups | The days with a completed full or incremental backup, and the time since the last one. |
Read the highlights
A card shows only when it has something to tell, for example Database time, Top SQL or Busy hours. Some cards have a limit or need another feature:
| Card | What it tells |
|---|---|
| Growth | The five segments that grew the most. Needs the Sizing layer of Cache. |
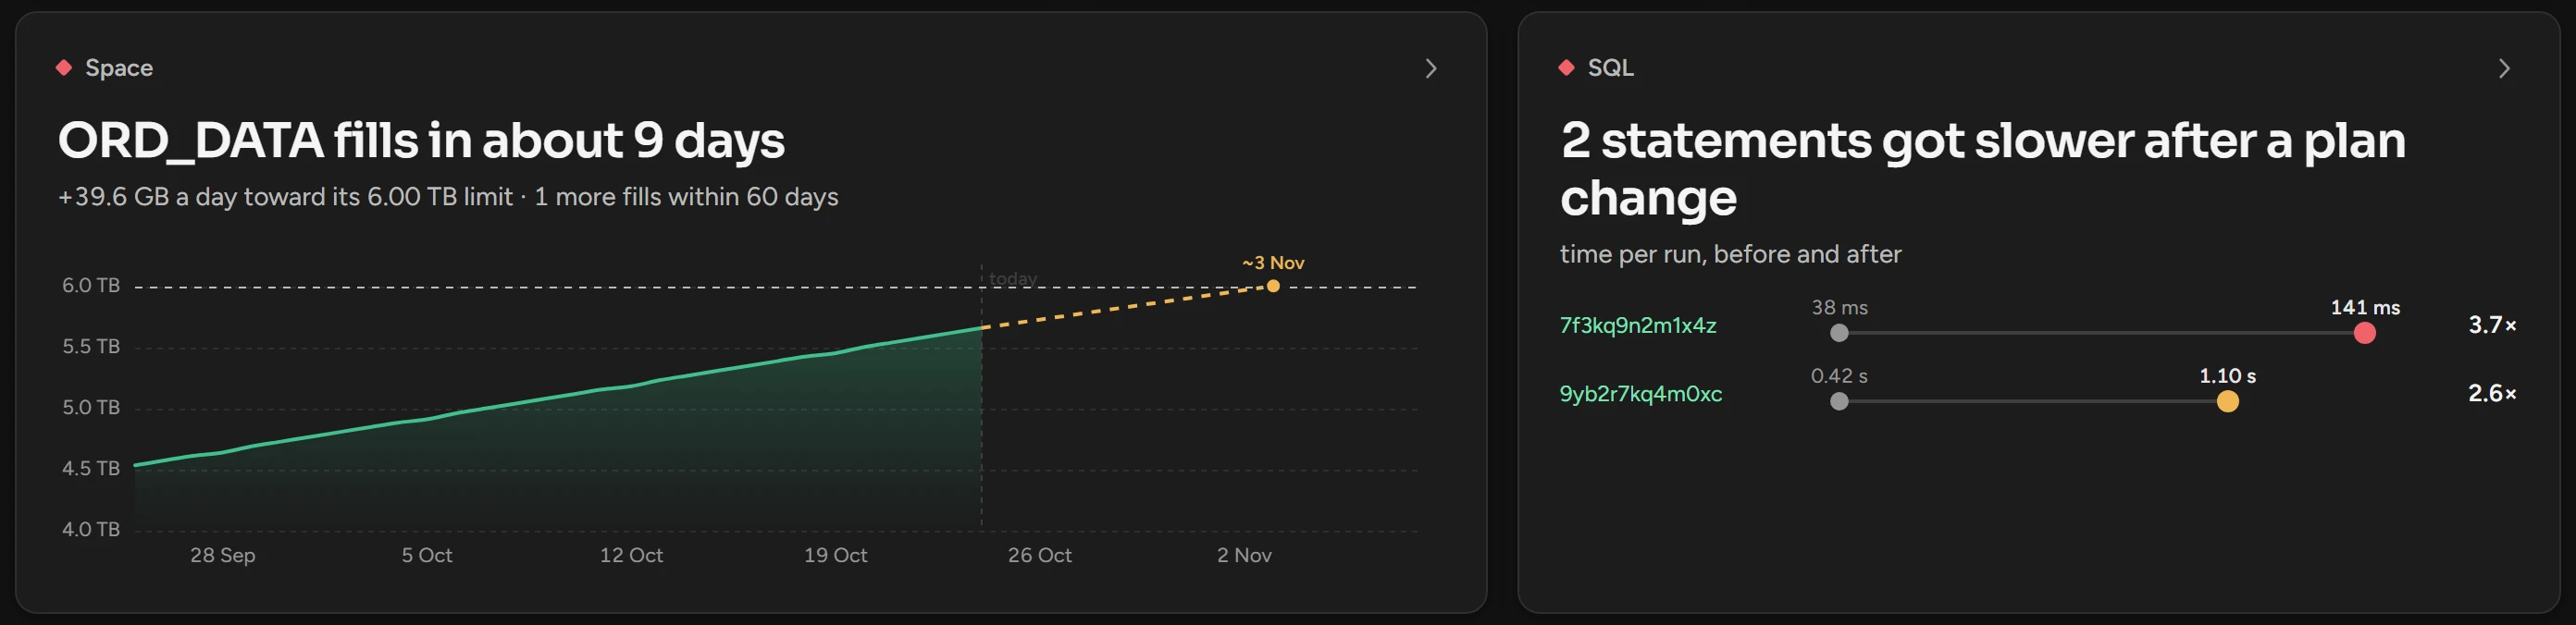
| Space | The tablespace or ASM disk group that fills first, within 60 days. Red within 14 days. |
| SQL | Statements that are 1.5 times slower per run on a new plan. Red from 3 times. Needs the SQL statistics of Insights. |
Under the cards, one line tells what was normal. If Scops could not read a part, a last line shows Not read and its name.
Open the detail
Click a vital or a card. A side panel opens with its detail for the same 30 days, for example Slower SQL with the time per run before and after.
What Happened opens from Reachable, Backups, Changes and the line under the title. It lists the alerts, restarts, plan changes and collection problems of the window.
Related
Updated October 30, 2026