Reports
Run a report on the databases that you select, then read, filter and export the rows.
Before you begin
- You need View Reports.
- A report runs with the monitoring account of each database. The account must have grants on what the query reads.
- To create, schedule or mail a report, see Create a report.
Run a report
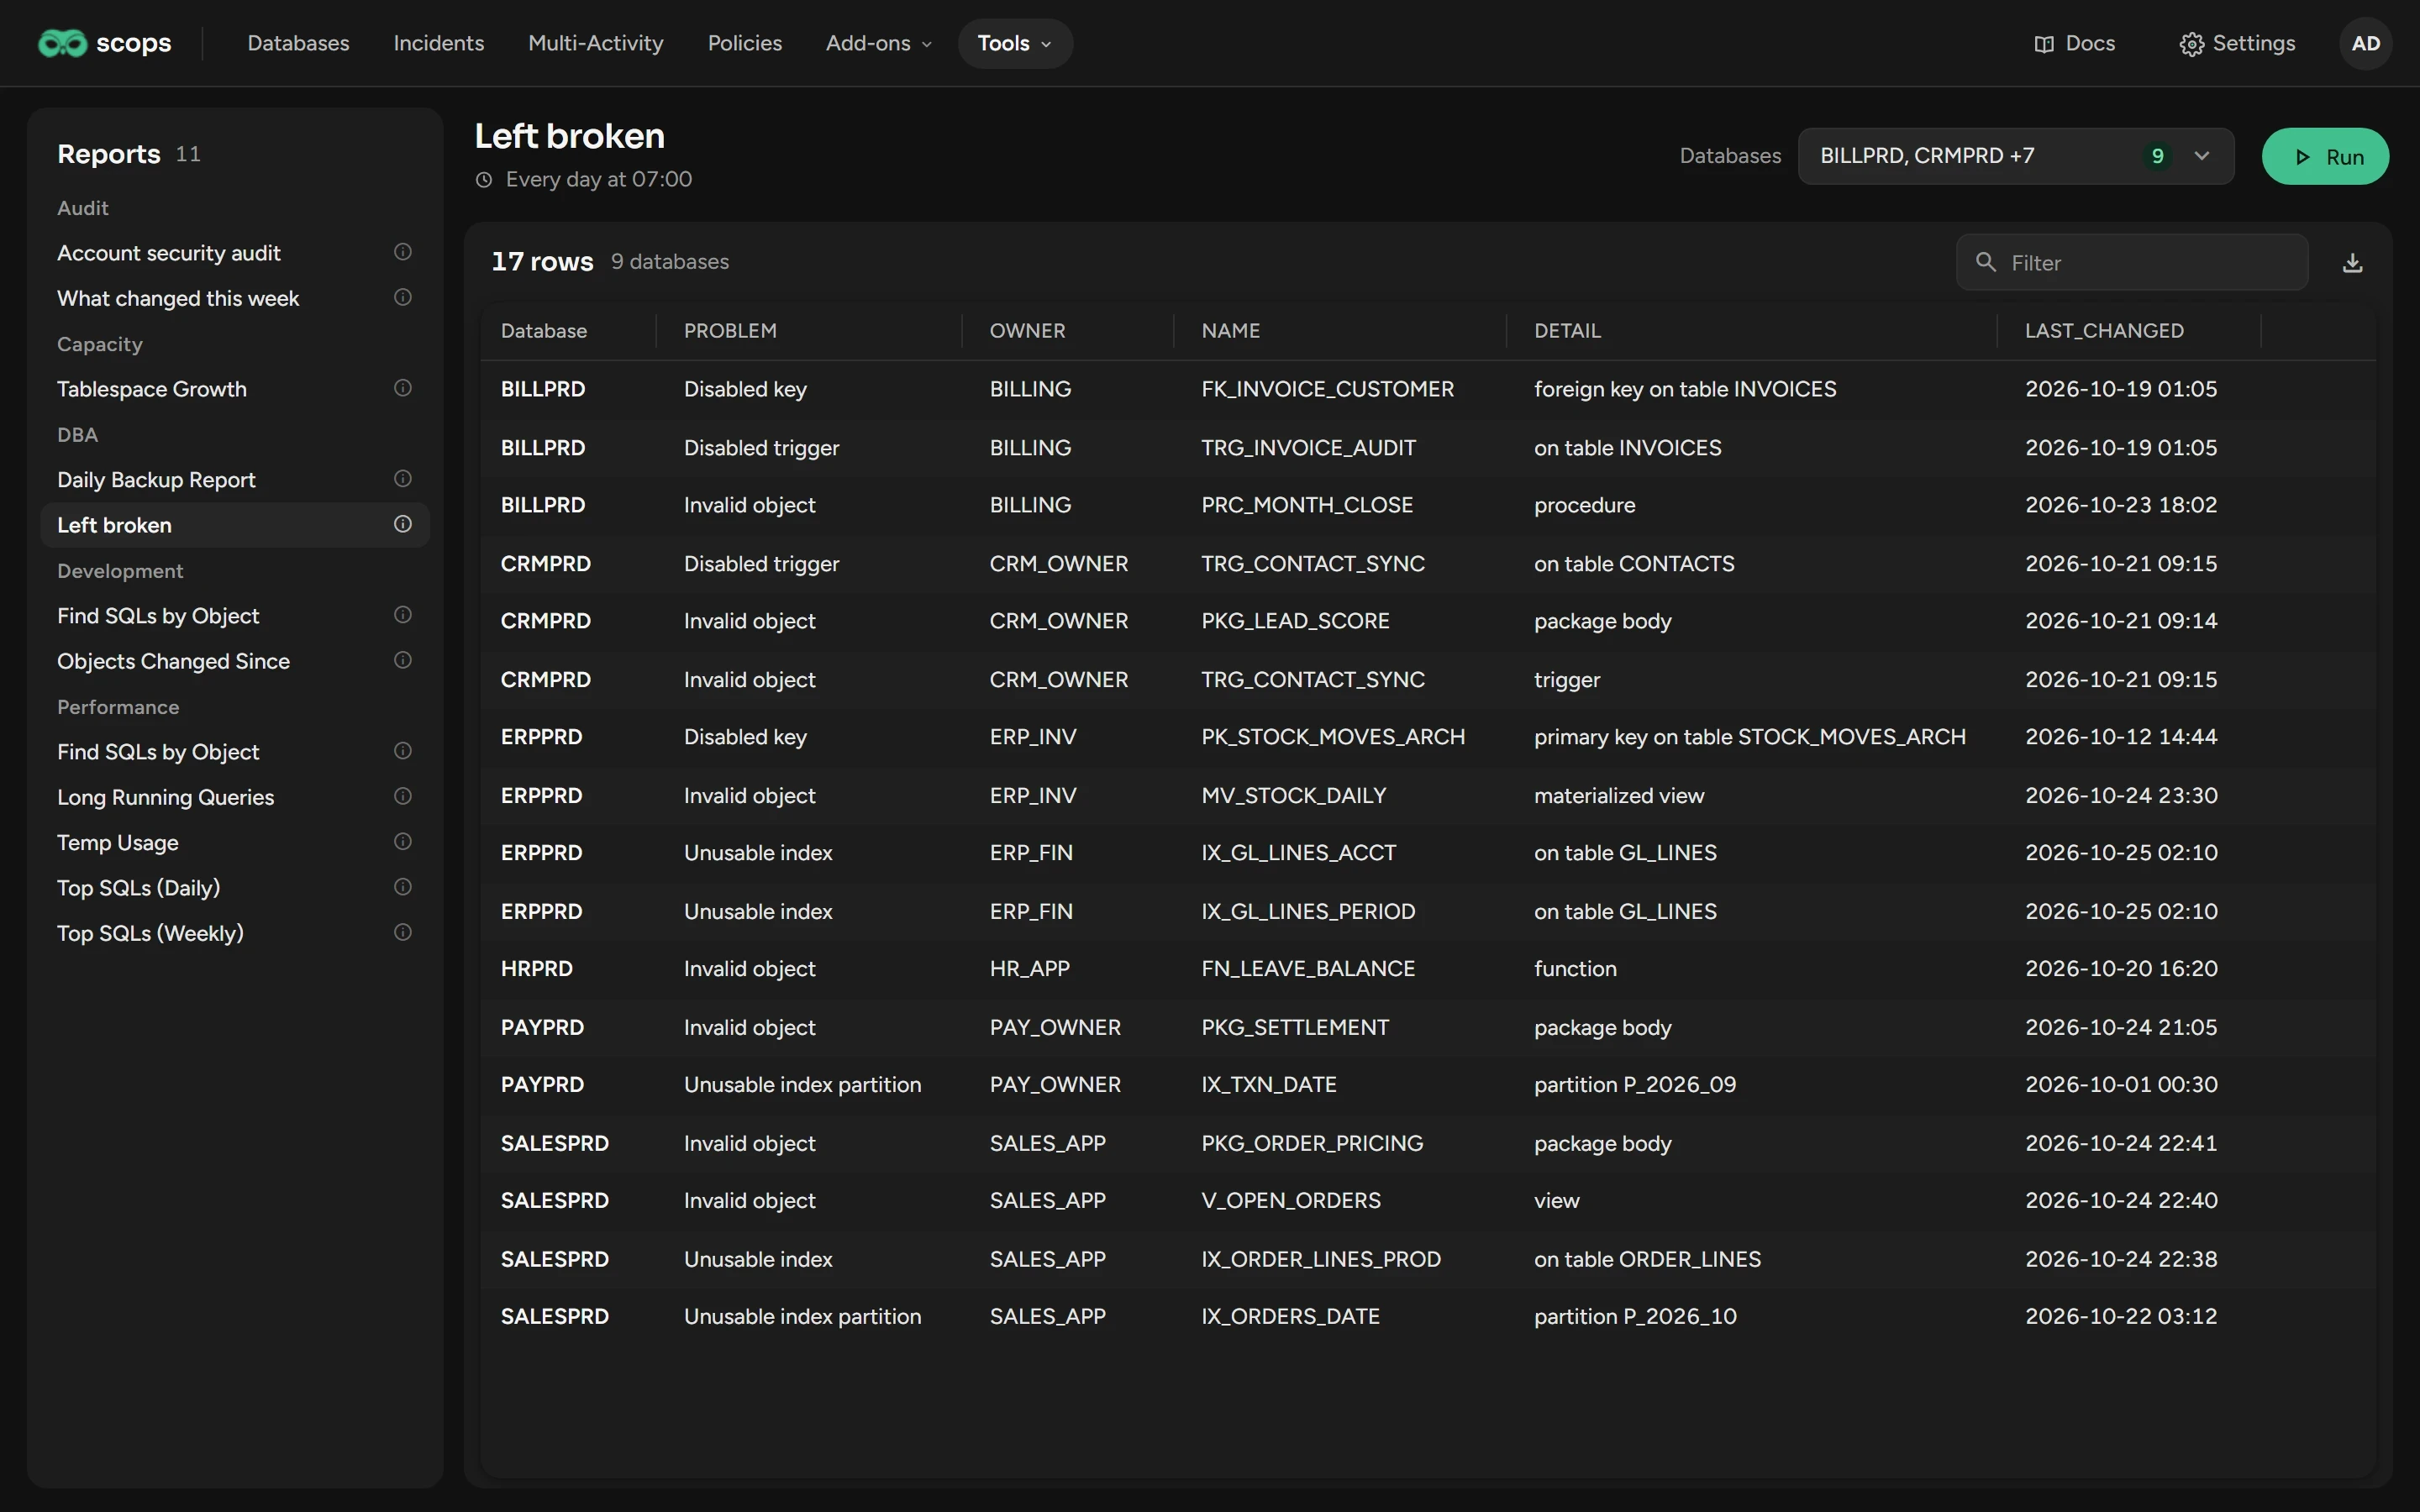
Open Tools › Reports and click a report. To see what it does and when it runs, point at its i.
Click Databases, select the databases and click Done.
Type the values that the report asks for, if any.
Click Run, or press Ctrl+Enter.
Scops runs the query on eight databases at a time. A database that it cannot read does not stop the others.
Read the result
The table shows the rows of all databases, with Database first. Click a column heading to sort. Type in Filter to keep the rows that contain your text.
| Line above the table | What it means |
|---|---|
| 2 not read (red) | The query could not run on these databases. Their rows are missing. |
| Showing the first 5,000 rows of ERPPRD — there were more. | A run keeps at most 5,000 rows for each database and 20,000 in all. |
| A red line without a number | The report failed. The line gives the reason. |
Export the result
Run the report.
Click the download button above the table.
The Excel file has all rows of the run, also the rows that Filter hides.
Read the kept results
A scheduled report can keep the rows of each run. Such a report shows Keeps 7 days, or its number of days, under its name.
Click the report and select the databases.
Set Start and End. By default, they show the last 25 hours.
Click Run. Scops reads the kept rows and does not run the query.
A window shows at most 5,000 rows, and a line names each database that has no rows in it.
Show a chart
A report that draws a chart shows it when you run the report on one database.
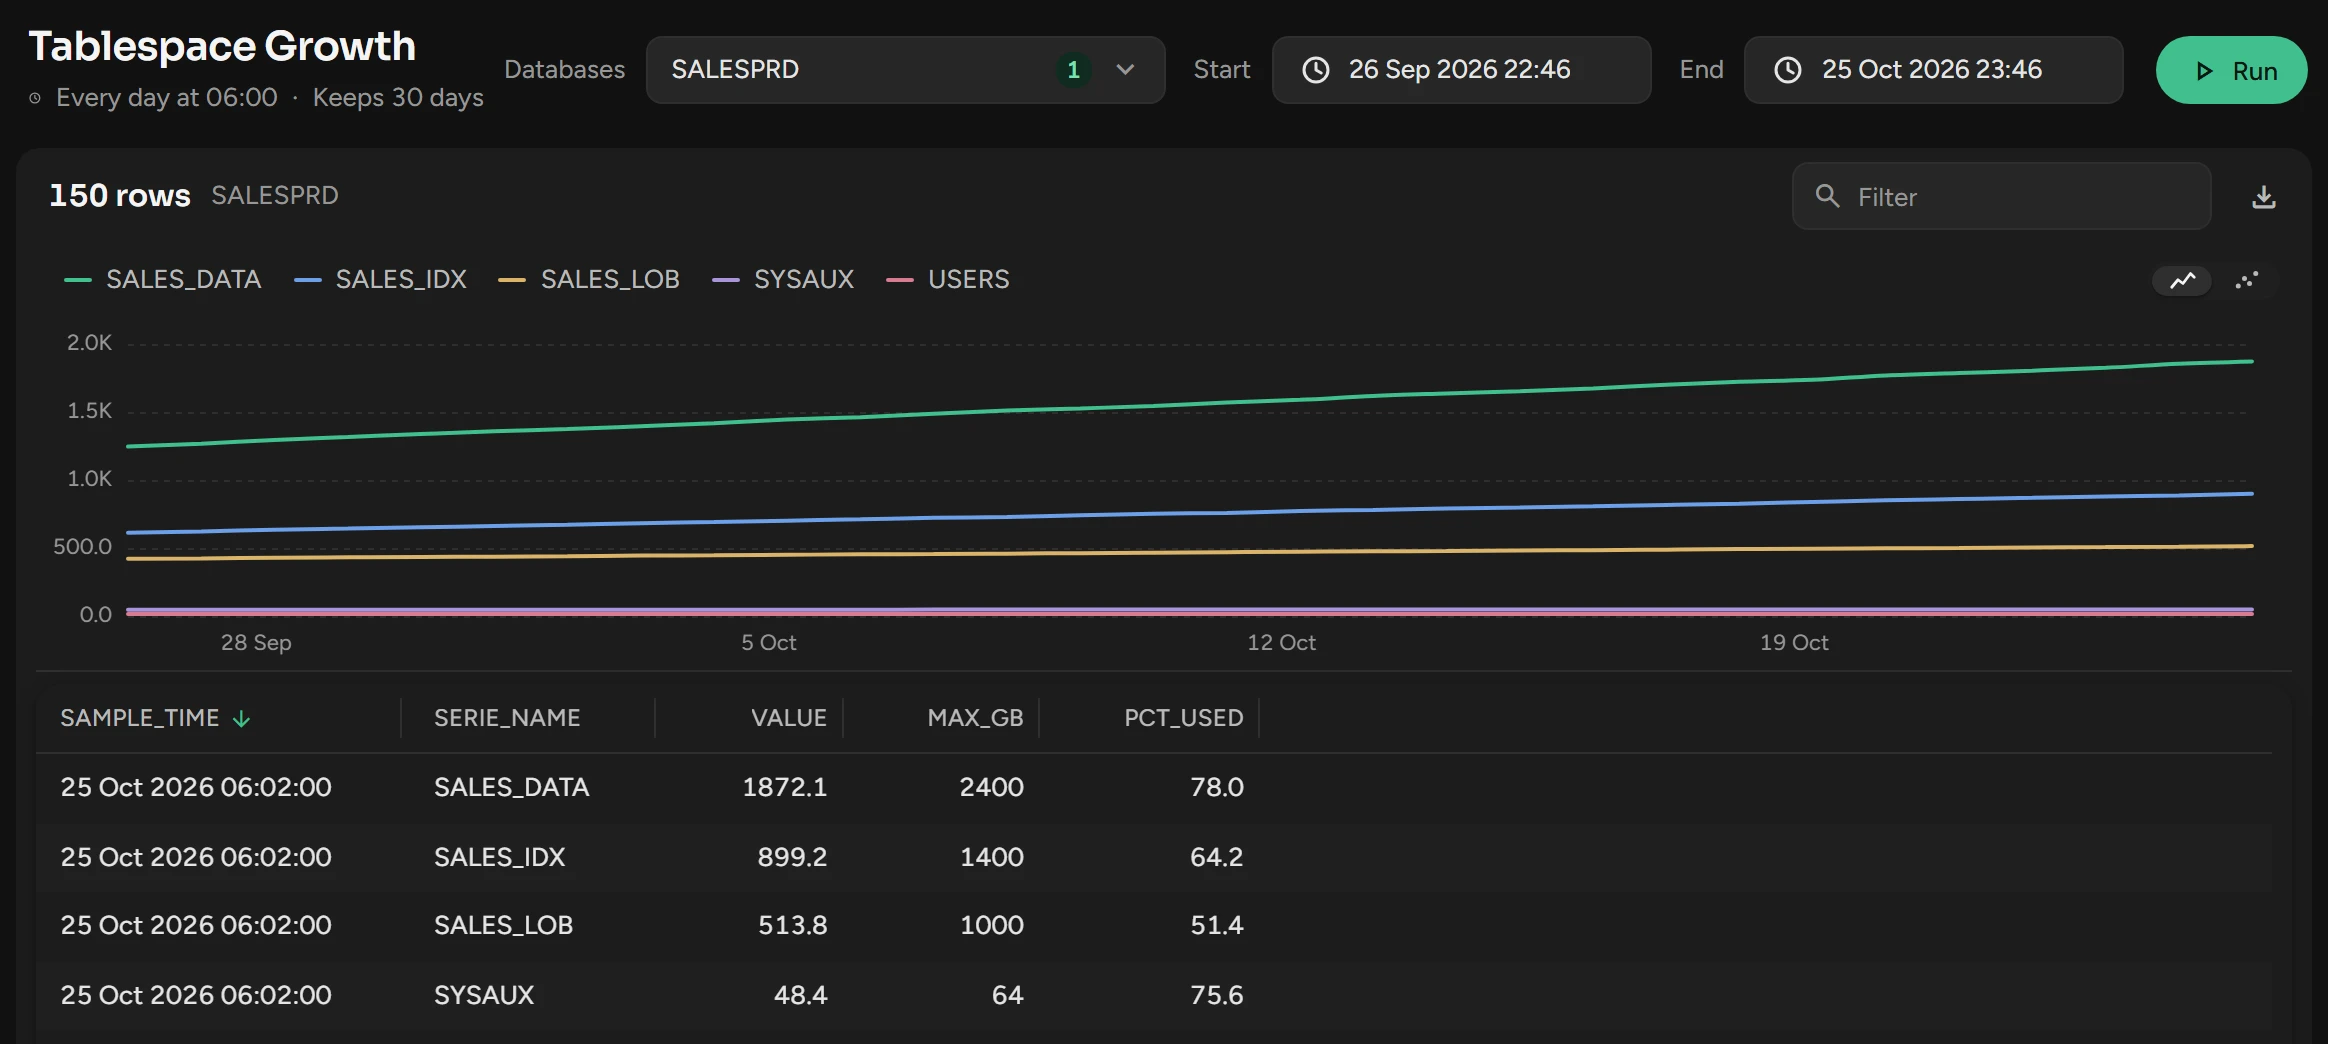
Click the report and select one database.
Click Run. The chart shows above the table, with a line for each series.
Point at the chart to read the values. To show points in place of lines, click the points button above the chart.
A chart shows at most 16 series.
Built-in reports
A new installation has these eight reports. They run only when asked until someone gives them a schedule. None needs the Diagnostics or Tuning Pack.
| Report | What it shows |
|---|---|
| Top SQLs (Daily), Top SQLs (Weekly) | The 50 heaviest statements of the last 24 hours or 7 days. |
| Daily Backup Report | The last full or incremental backup of each database. |
| Find SQLs by Object | The statements whose plans use an object. Type the owner and the name in upper case. |
| Temp Usage | Temporary space in use now, per session. |
| What changed this week | Parameters changed, and objects created or altered, in the last 7 days. |
| Account security audit | DBA and high-privilege accounts, open accounts with a default password or unused for 90 days, and passwords that expire within 30 days. |
| Left broken | Unusable indexes, invalid objects, and disabled keys and triggers. |
The list shows the reports by category. A report with no category shows under No category.
Related
Updated October 31, 2026