Sizing
Use Sizing to see where the space of one database is, what grew or was freed, and which tables to compress or partition.
Before you begin
- You need the View Sizing permission.
- Scops records the size of all segments each day at 03:00 (the Repo Collector job on the Jobs page). A new database gets its first snapshot in a few minutes. Scops keeps the snapshots for 90 days by default, 15 days in the Community edition.
Choose the window
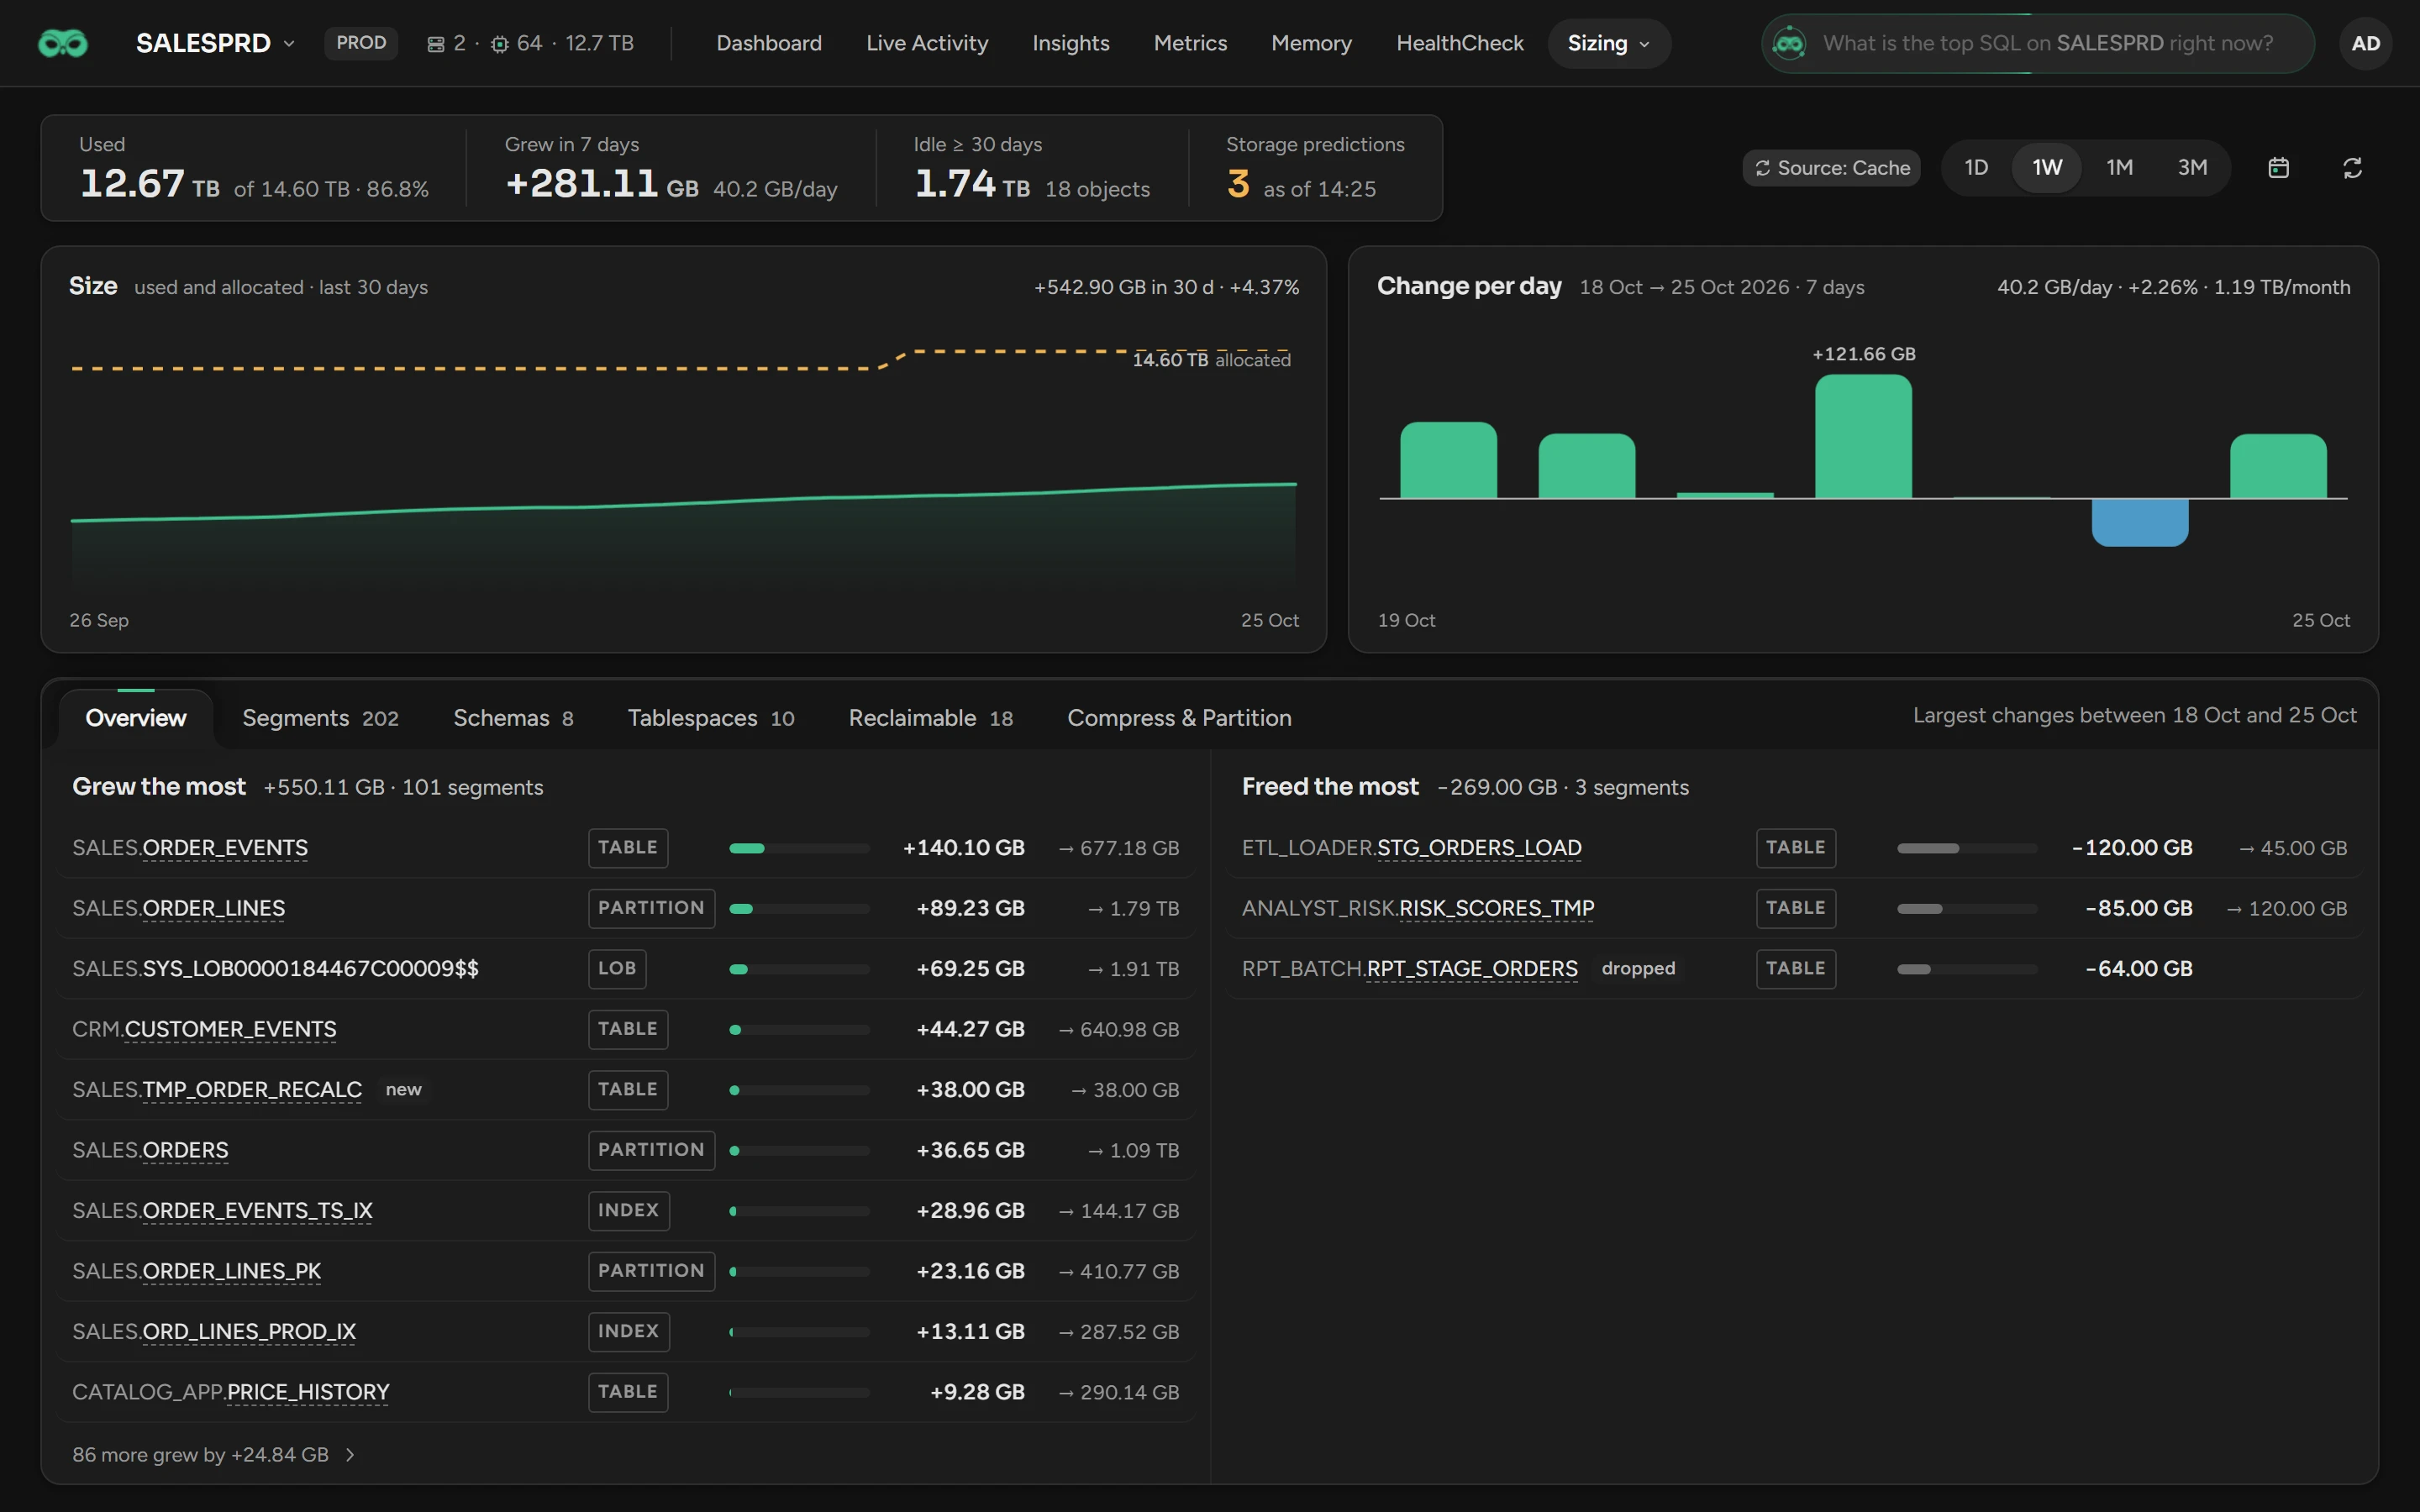
Click 1W, 1M (the default) or 1Y. 1Y goes back as far as the kept snapshots. For other dates, click the calendar button, select two snapshot days in From and to, and click Apply. The page compares the two snapshots.
Read the top line
| Value | What it shows | Click to open |
|---|---|---|
| Used | The used space, the allocated space, and how full that is. | Tablespaces |
| Grew in 30 days | The change of all segments in the window, and the rate per day. | Overview |
| Idle ≥ 30 days | The segments with no recorded access for 30 days. | Reclaimable |
| Storage predictions | The open space predictions of Radar Engine, red when one is critical. | — |
Read the two charts
- Size: the used space over 30 days, with the allocated space as a dashed line.
- Change per day: one bar for each day. A bar below the line is a day that freed more space than it used. Click a bar to compare that day with the snapshot before it. The page then shows the changes of that day only. To go back to the full window, click the same bar again or the two dates above the chart.
Find what grew or was freed
On Overview, Grew the most and Freed the most show up to 15 segments each. new marks a segment created in the window, and dropped a segment that is gone. Click a row for its size chart, or its name for the object details.
Find a large segment
Click Segments. It lists all segments, the largest first. A partitioned table or index is one row.
To narrow the list, search, or filter by type.
Open a row to see its size over 30 or 90 days, with a Forecast. Queries Using This Table lists the statements that use it.
See the space per schema or tablespace
Schemas and Tablespaces show the totals per owner and per tablespace. A tablespace also shows its Radar fill date, and Segments → lists its segments.
Find space to reclaim
Reclaimable lists the segments with no recorded access for 30 days, the largest first. Dead Weight marks the segments to act on: 0.5 GB or more, not growing, and last used 30 days ago or more.
Last Access is the last time that a statement of your applications used the segment. Statistics gathering, dynamic sampling, Data Pump, GoldenGate, scheduler jobs and Scops do not count.
A segment that no plan used shows not recorded and is never dead weight. Until the record of Scops covers 30 days, it shows too new to tell.
Find tables to compress or partition
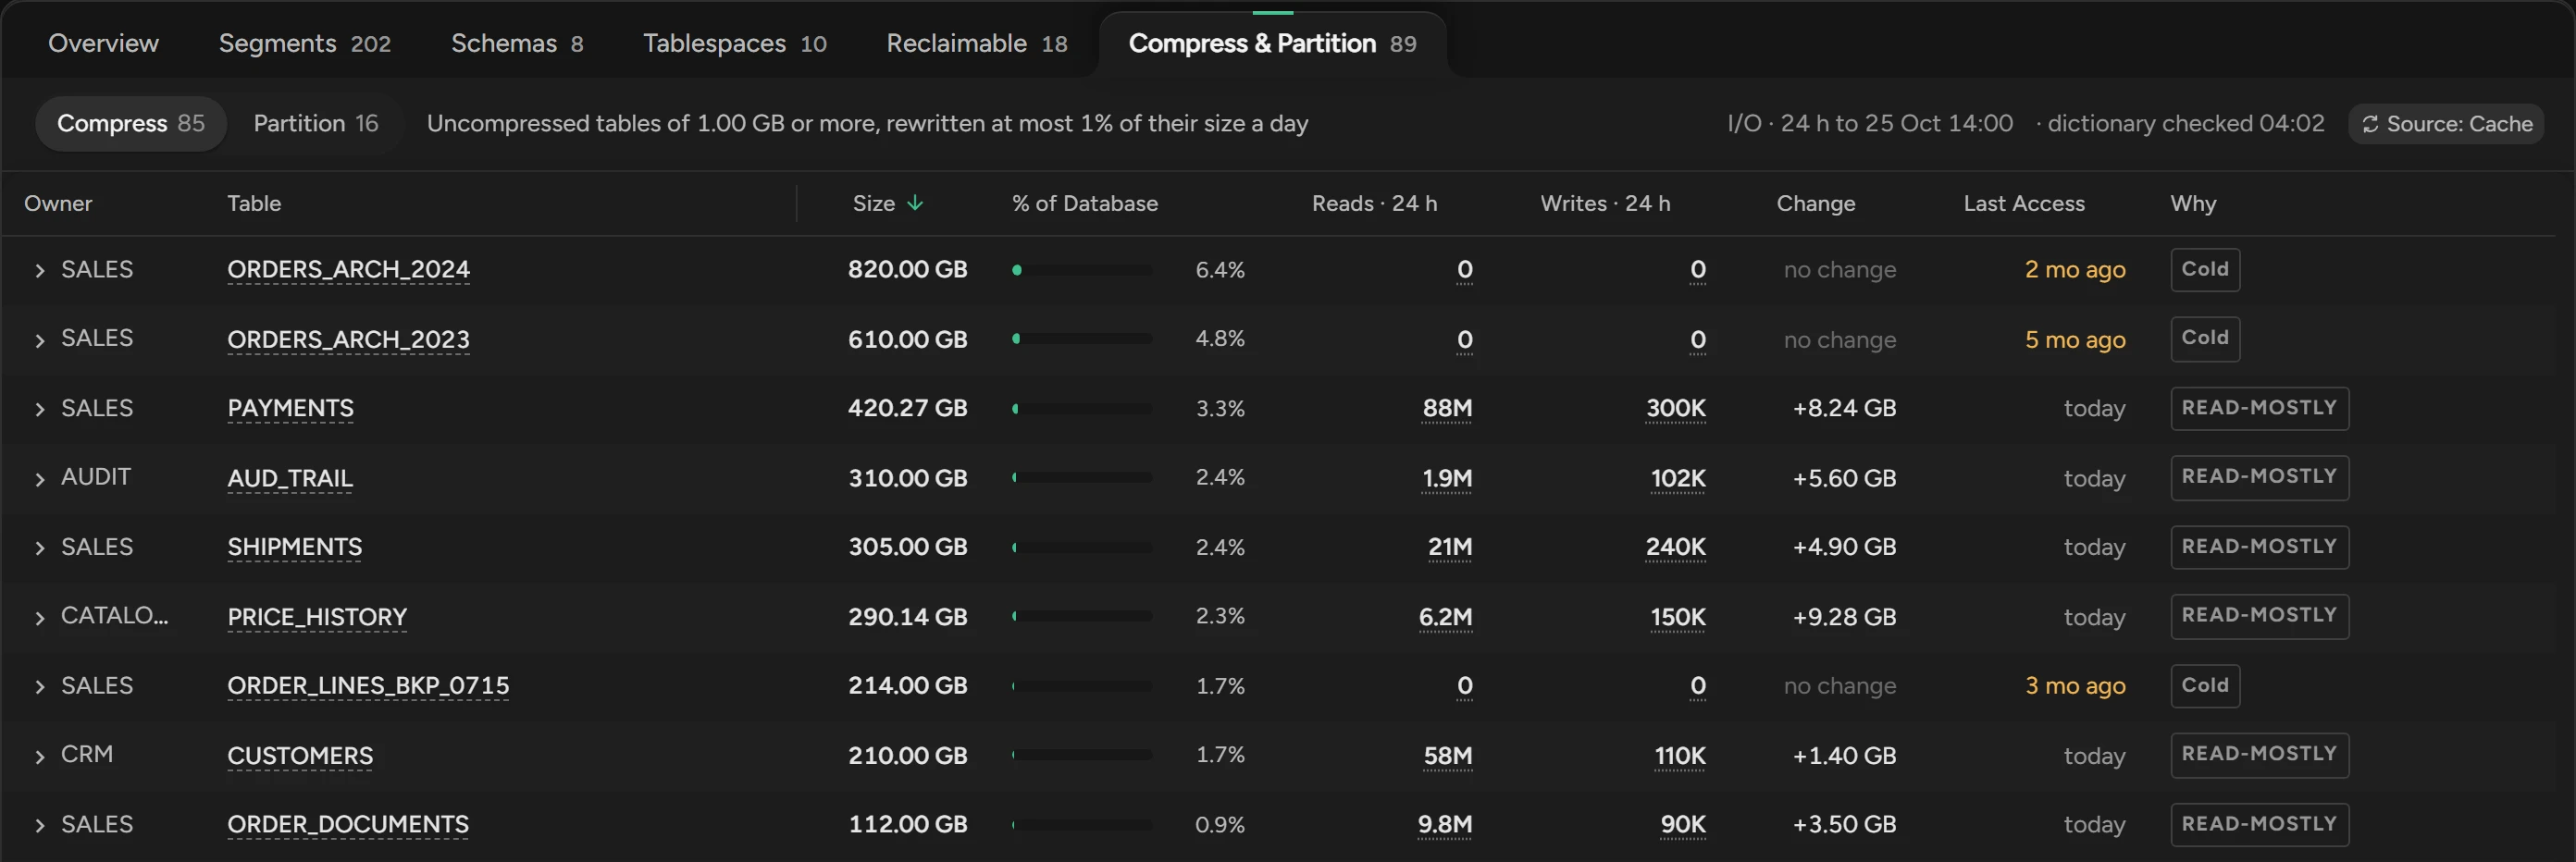
Compress & Partition has two lists of up to 200 tables:
| List | Which tables | Tags |
|---|---|---|
| Compress | Uncompressed tables of 1 GB or more that write 1% of their size a day or less. A partitioned table counts as compressed when more than half of its partitions are. | Cold: no read or write in the day. READ-MOSTLY: read, but rarely written. |
| Partition | Tables of 2 GB or more that are not partitioned. | READ-HEAVY: reads at least its own size a day, or 5% of all reads. Growing: grows at least 0.1% of its size or 1 GB a day. |
To act on the list, set up Compression. For cold, old tables, Archiving is often a better choice.
Related
Updated November 4, 2026