SQL details
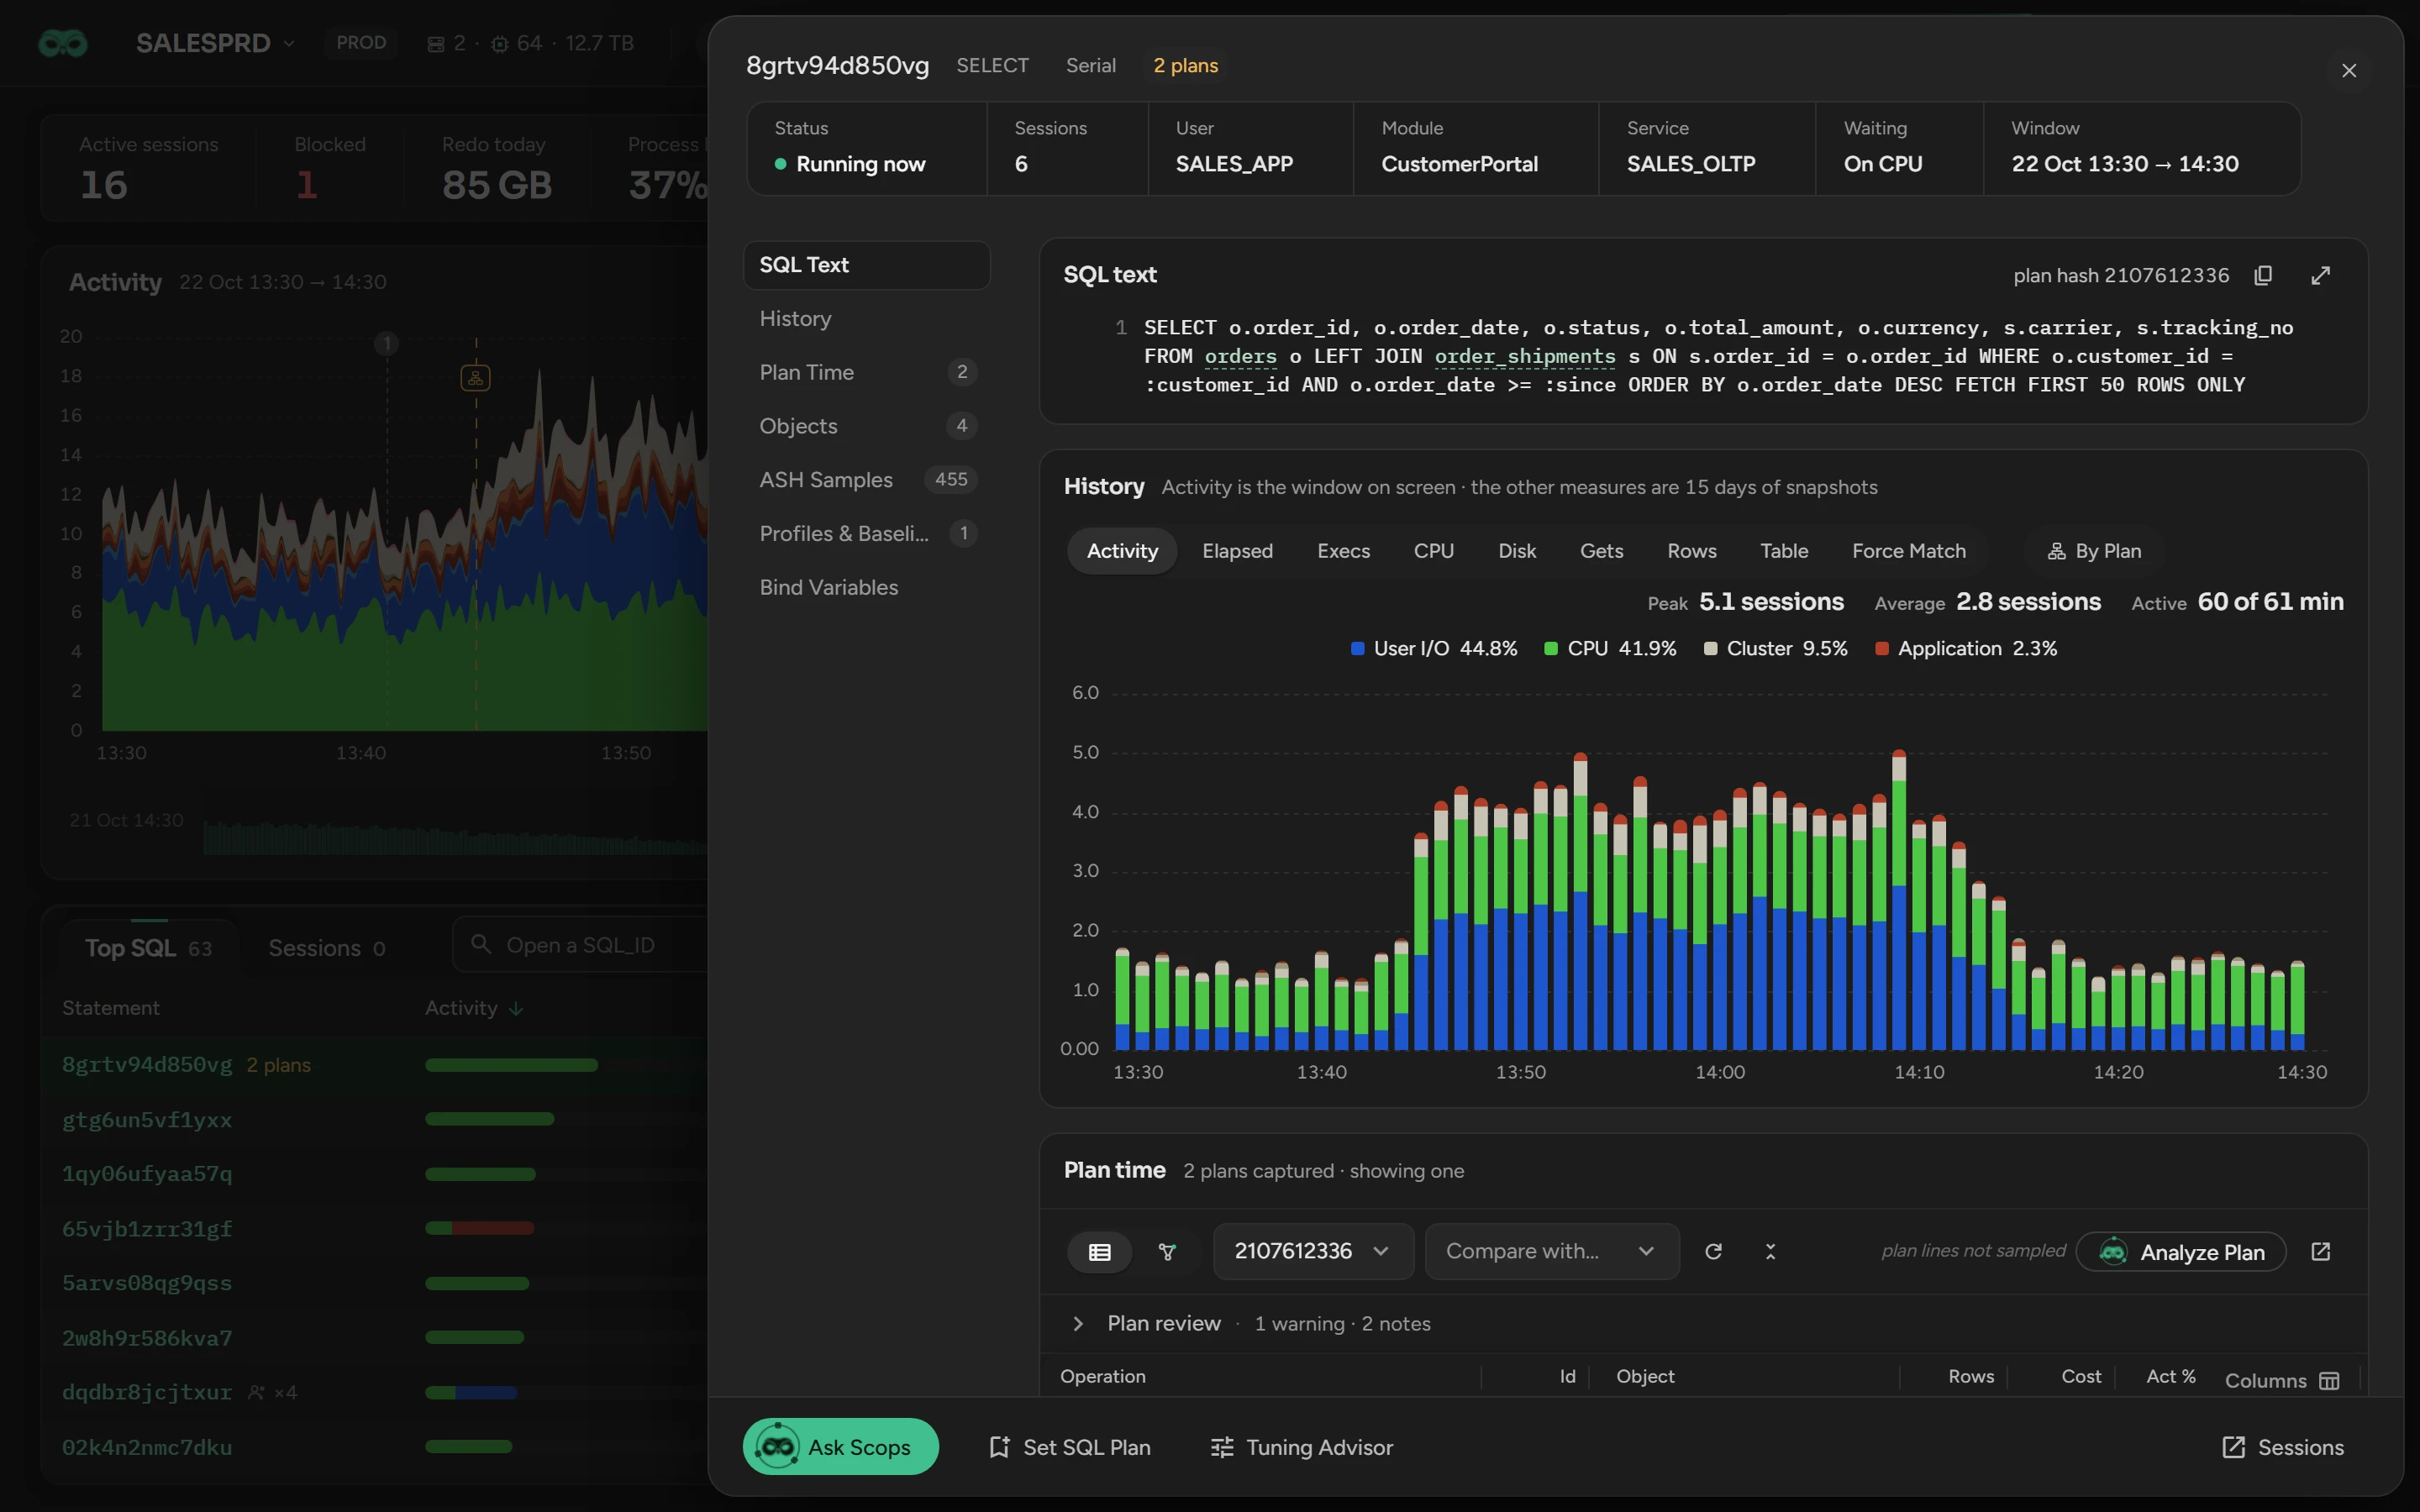
Use the SQL details sheet to examine one statement, put it on a good plan, or run the SQL Tuning Advisor.
Before you begin
To change plans, profiles and baselines, or to run the SQL Tuning Advisor:
- The Diagnostics and Tuning Pack switch of the database must be on (see Diagnostics and Tuning Pack). Baselines need Enterprise Edition, SQL profiles the Tuning Pack, and a plan from AWR the Diagnostics Pack.
- You need Manage SQL plans or Run SQL Tuning Advisor.
- The monitoring account needs the Diagnostics and Tuning Pack grants.
Open a statement
Click a SQL_ID on any page of a database, or type it in the search box on the Dashboard and press Enter. The sheet shows the period of the page (Window in the header), or the last hour from Live Activity.
In the header, not in this window means that Scops sampled no session of the statement in the period.
Read the SQL text
The buttons in the section header copy the statement and open a larger view. Click an underlined table or index name to see its details.
Examine the history
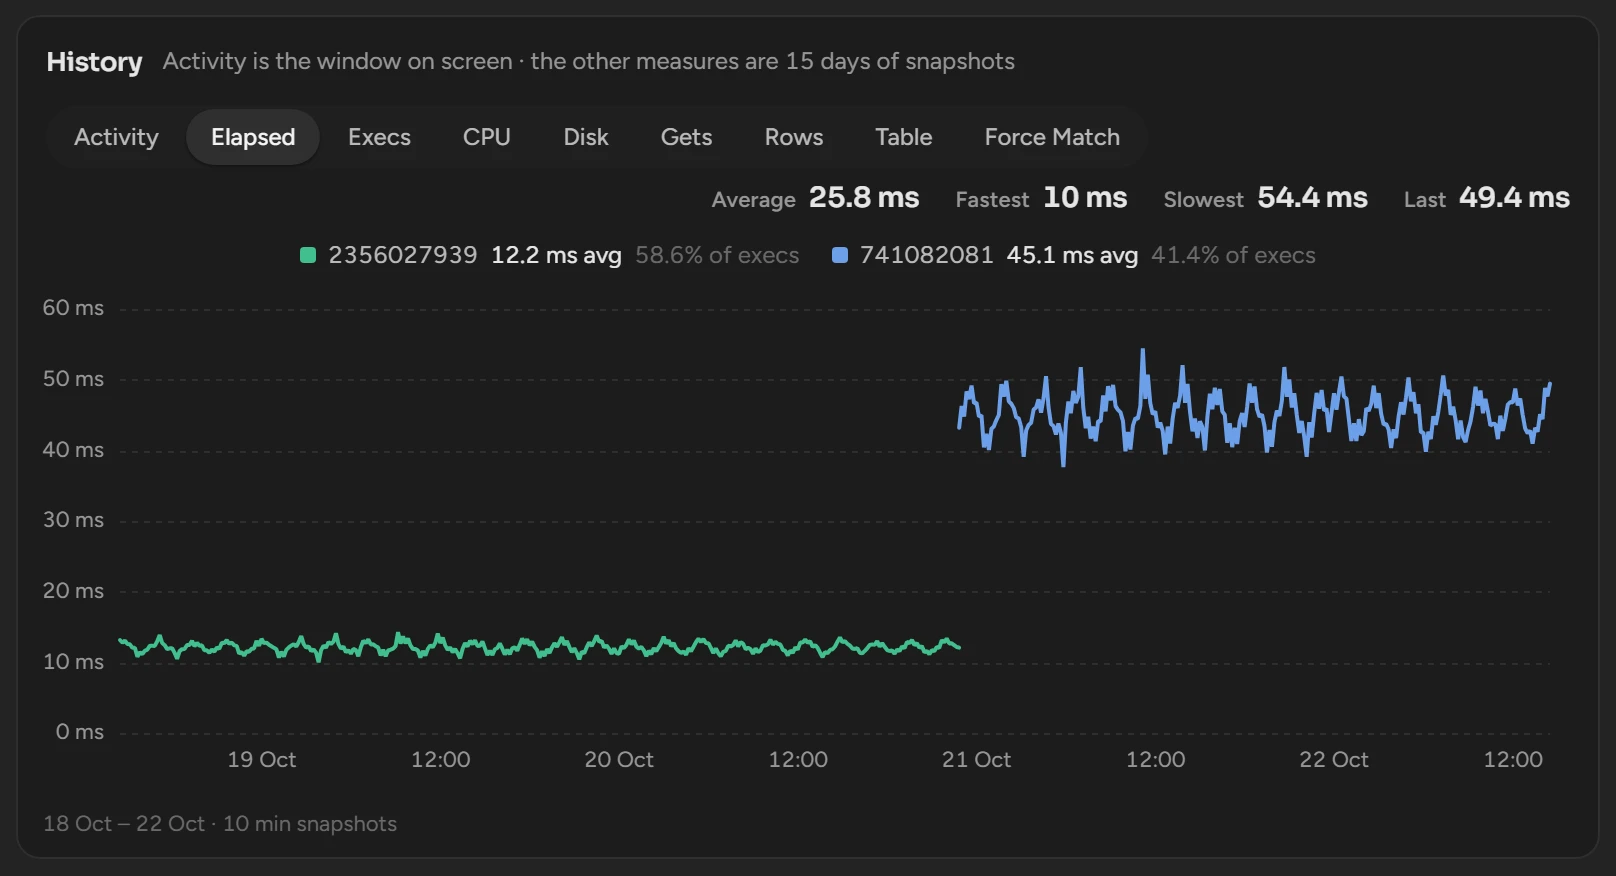
| Measure | What it shows |
|---|---|
| Activity | The active sessions of the statement in the window. By Plan shows when one plan replaced another. |
| Elapsed, CPU, Disk, Gets, Rows | Per execution, one line per plan. Drag across the chart to zoom. |
| Force Match | The SQL_IDs with the same text and other literal values. Click Search 15 Days to find them. |
Select 1D, 1W or 1M to show the last 24 hours, 7 days or 30 days. The sheet opens on 1D. If the last 24 hours have fewer than 12 snapshots of the statement, it opens on 1W. If the last 7 days also have fewer than 12, it opens on 1M. If the page shows an earlier period, the sheet opens on a range that includes it.
For a parallel statement, the elapsed time adds up all parallel servers. It is not the duration of a run. If Scops measured the runs, Show Duration / Exec shows the duration.
Examine the plan
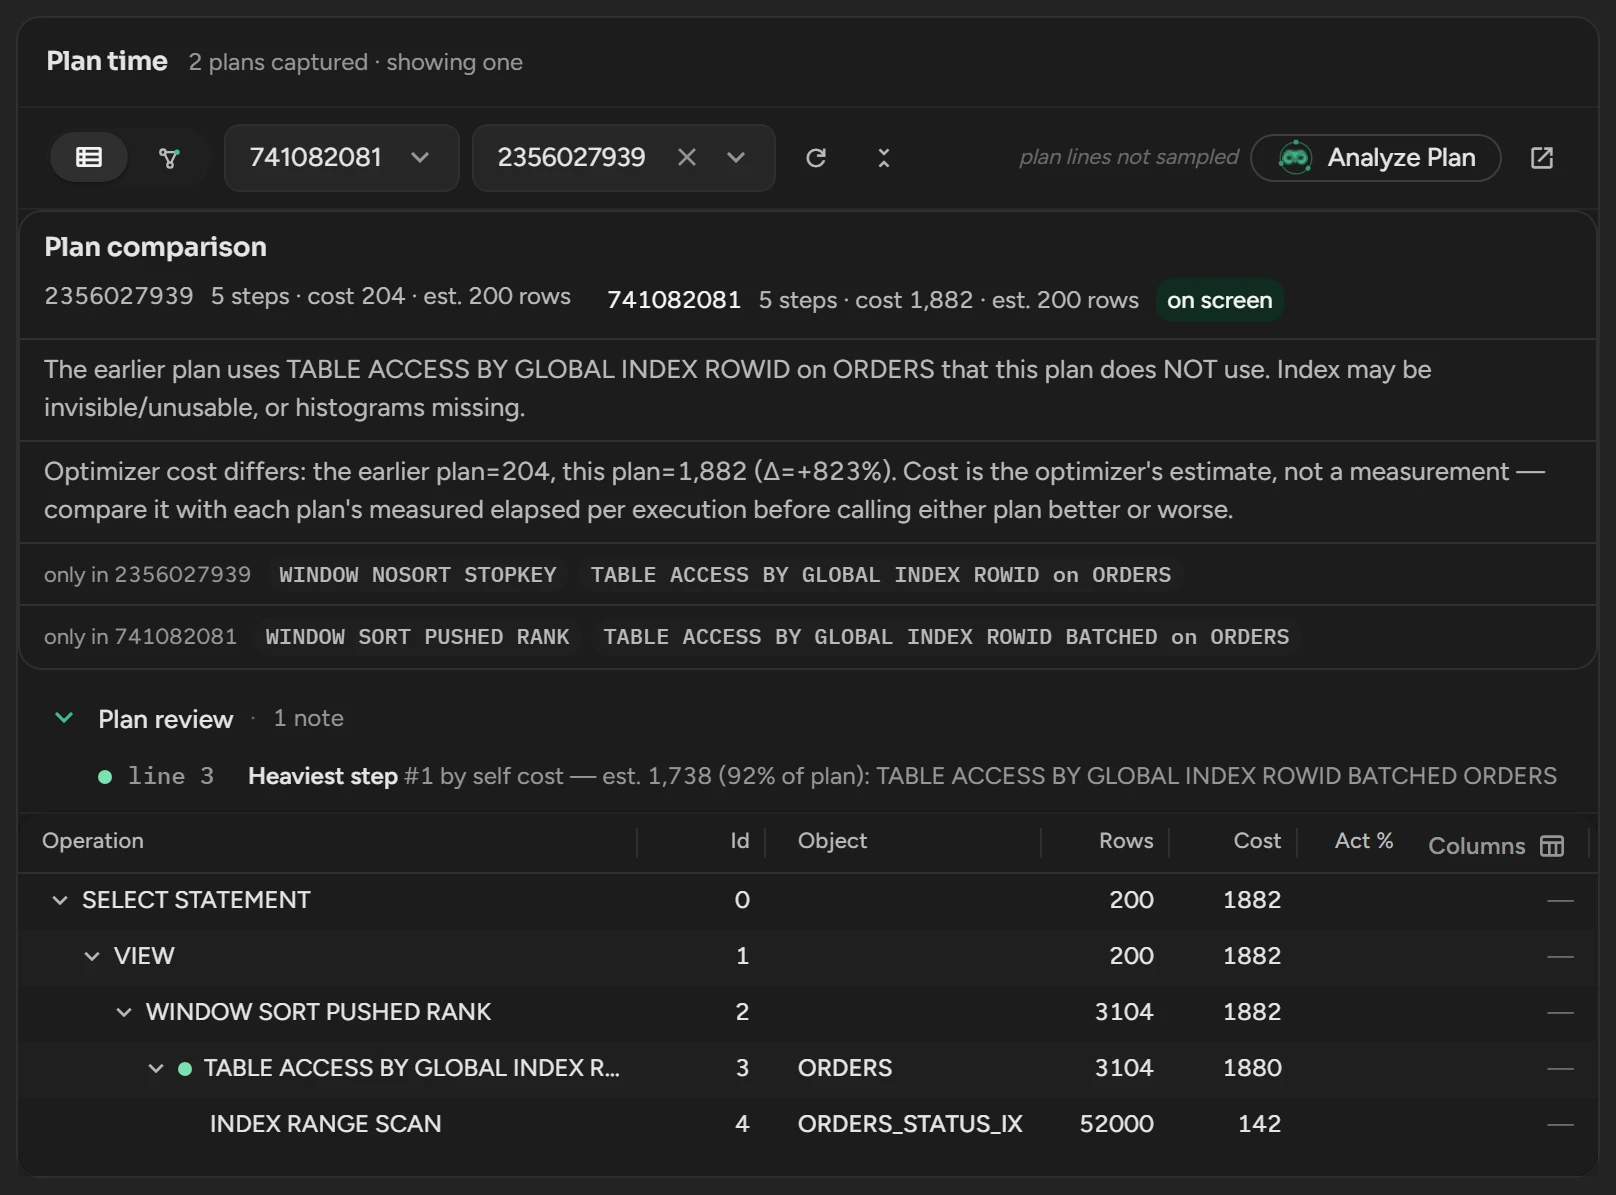
- List view shows the plan as a tree, and Map view as a diagram. The current plan is first in the plan list.
- Plan review shows common problems, such as Cartesian joins, implicit conversions, spills to temp and stale statistics. Click one to go to its plan line.
- Compare with shows the differences from another plan. It compares estimates, not measured time.
- Columns adds columns, such as the predicates.
"plan not available for this hash" means that neither the cursor cache nor Scops has the plan.
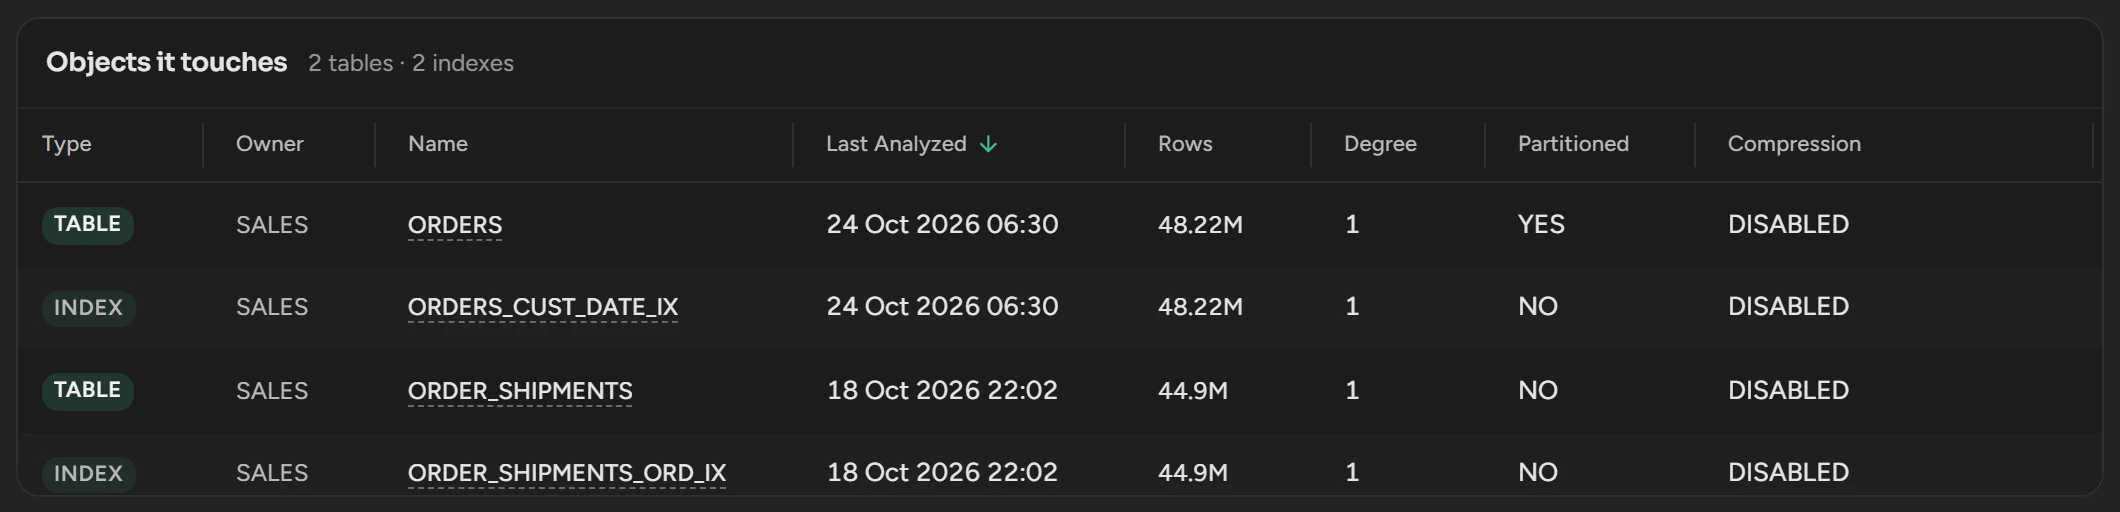
Objects it touches
The tables and indexes in the plan, with their optimizer statistics. A statement that is not in the cursor cache shows none.
ASH samples
Up to 1,000 session samples of the statement in the last five minutes of the window. They come from Scops, not from the Active Session History of Oracle. Click a session to open its details.
Profiles and baselines
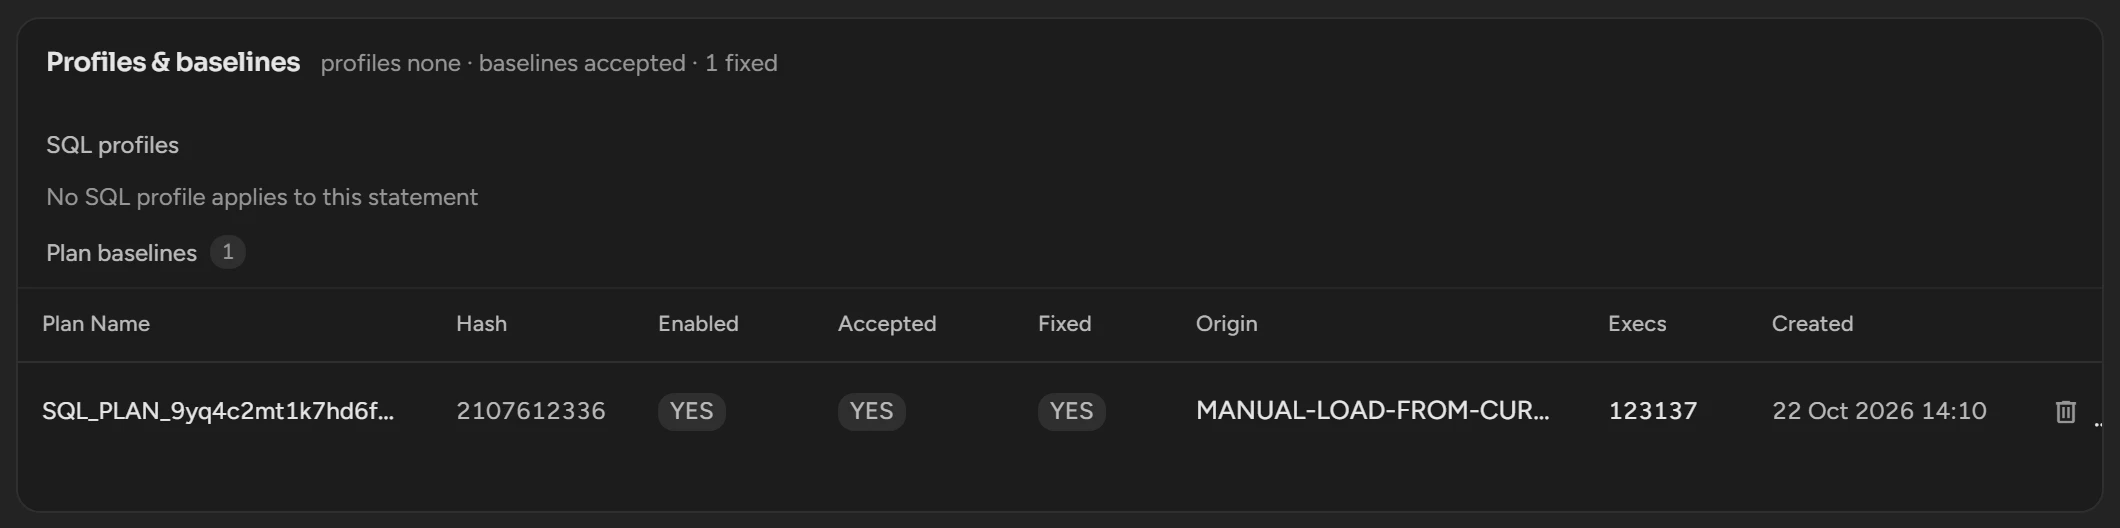
- To enable or disable a SQL profile, click its Status.
- To change a plan baseline, click its Enabled or Fixed. You cannot change Accepted.
- To drop a profile or a baseline plan, click the delete button of its row and confirm.
You need Manage SQL plans and the Diagnostics and Tuning Pack switch.
Load the bind values
Bind values can contain customer data, so Scops reads them only when you click Load. Oracle captures them only about every 15 minutes per cursor, so an empty list is normal.
Set SQL Plan
Set SQL Plan changes the plan of the statement for all sessions.
Click Set SQL Plan at the bottom of the sheet.
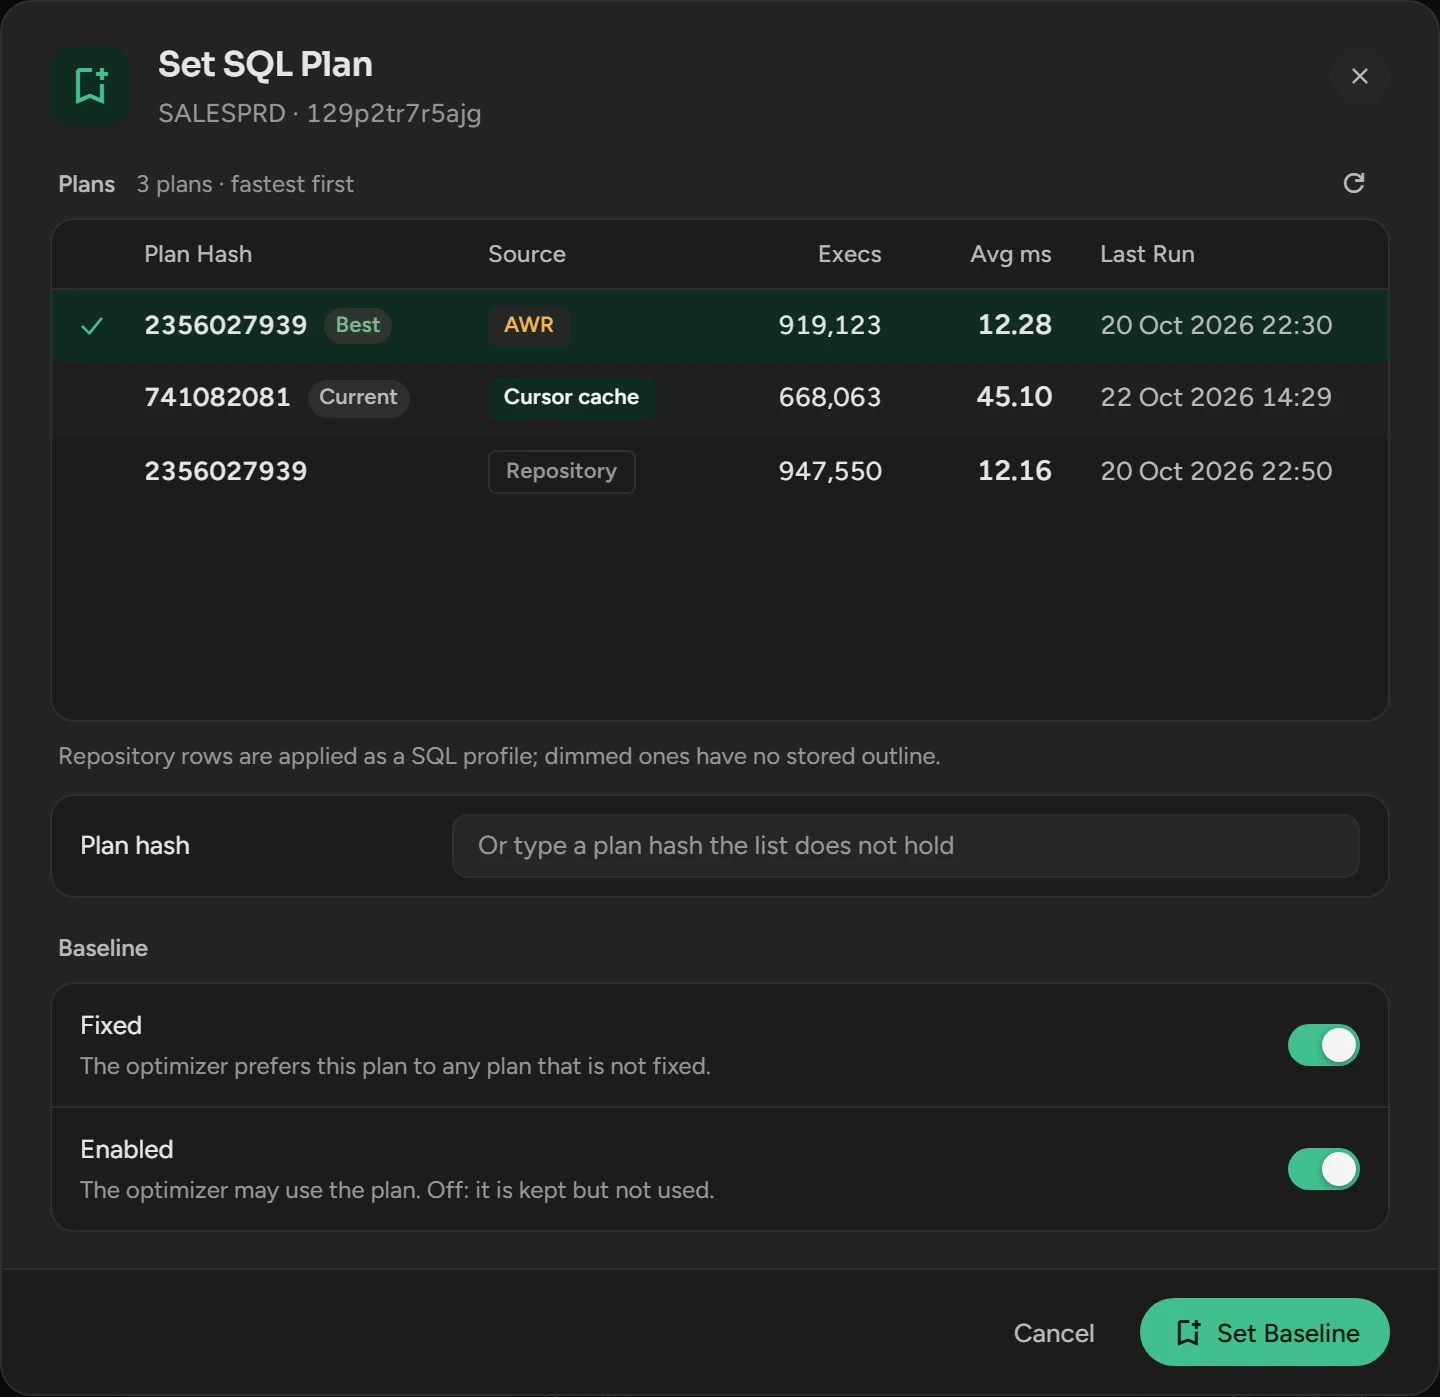
Select a plan. Best is the fastest plan that Oracle can load, and Current the plan of the last run. For another plan, type its hash in Plan hash.
For a baseline, keep Fixed and Enabled on. For a profile, turn on Force matching to cover other literal values.
Click Set Baseline or Create Profile.
| The plan is in | Scops creates |
|---|---|
| The cursor cache or AWR | A SQL plan baseline, with DBMS_SPM |
| The repository only | A SQL profile from the outline that Scops stored, with DBMS_SQLTUNE.IMPORT_SQL_PROFILE |
You cannot select a repository plan without a stored outline. If the statement already has a SQL profile, Scops does not overwrite it: the dialog shows Replace.
To undo, drop the baseline or the profile in Profiles and baselines.
Run the SQL Tuning Advisor
Click Tuning Advisor at the bottom of the sheet.
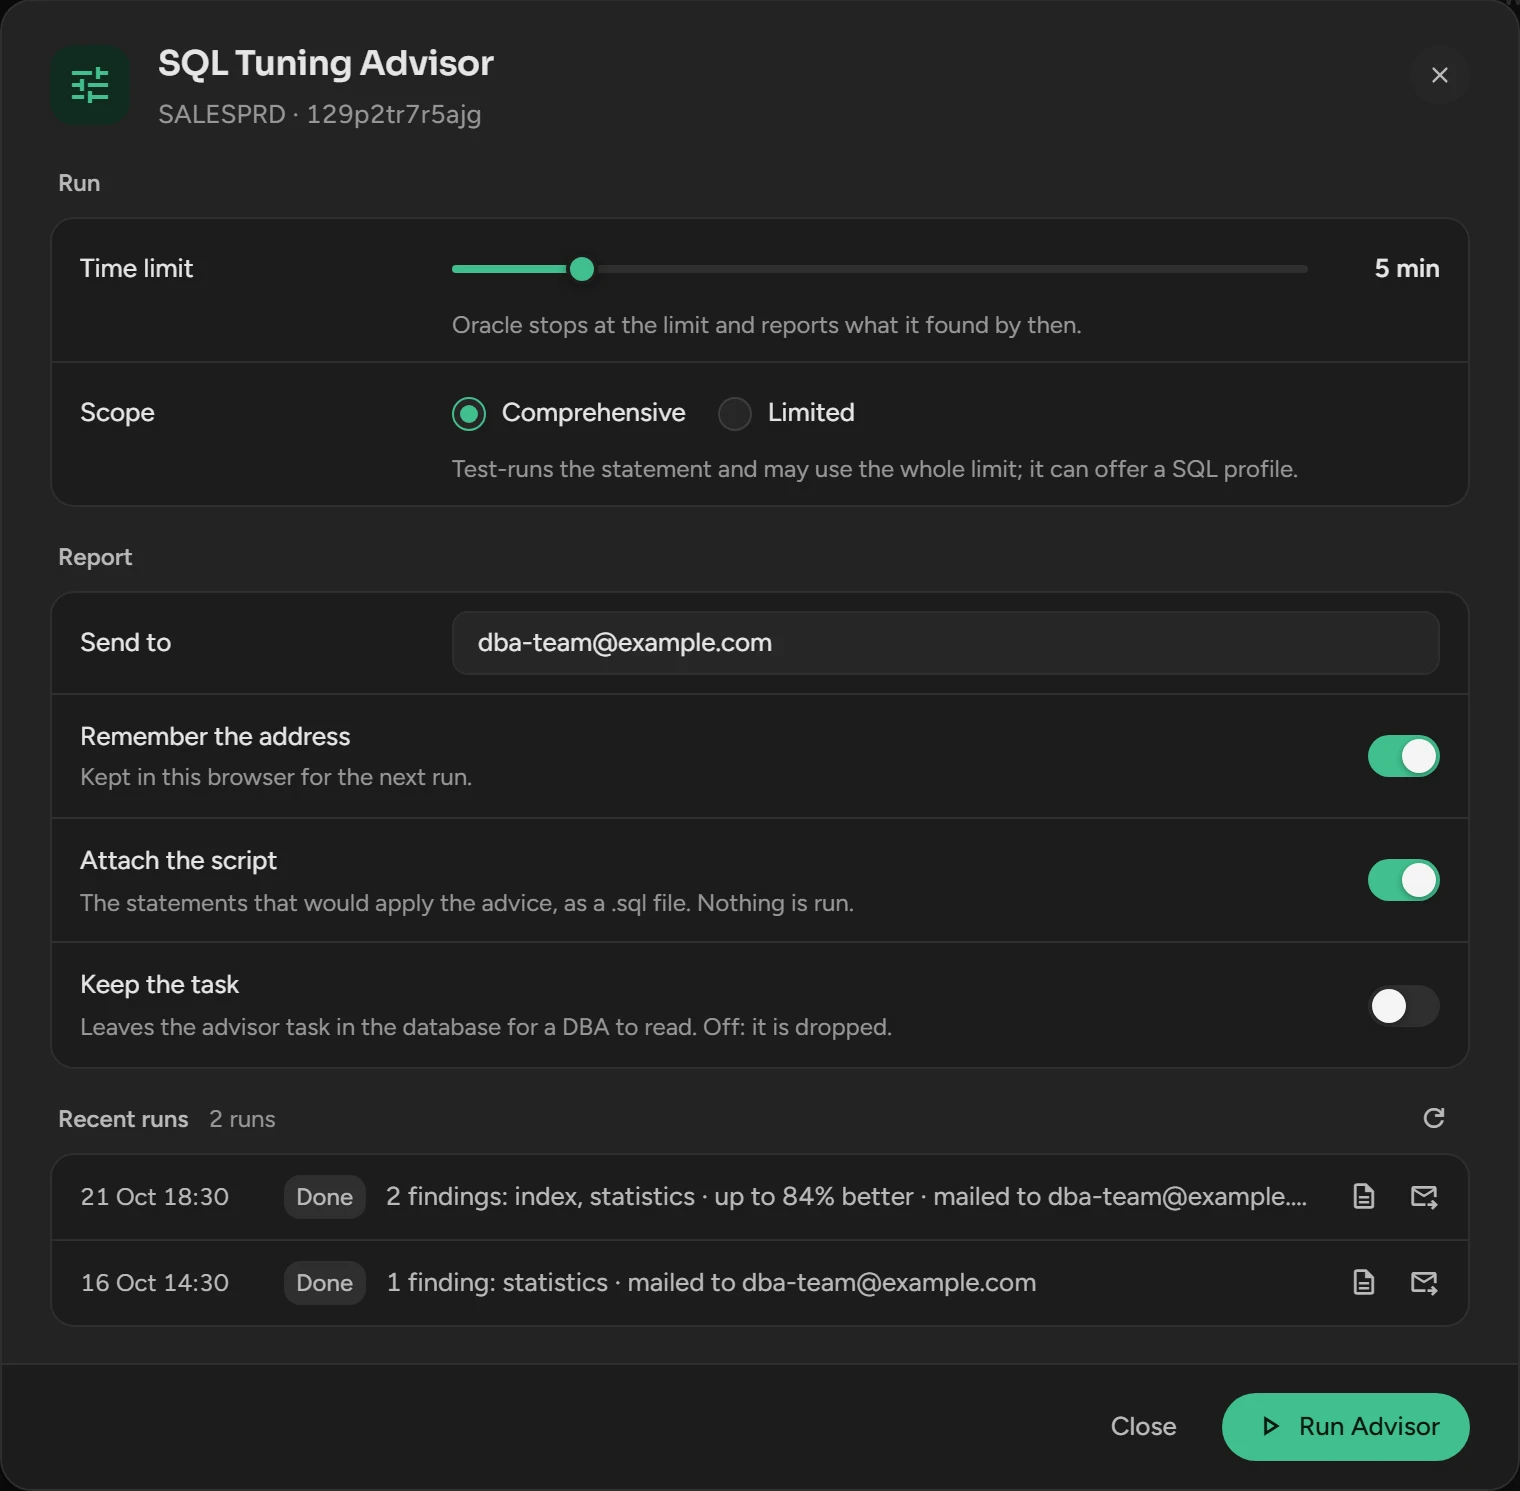
Set the fields in the table below.
Click Run Advisor.
| Field | What it does |
|---|---|
| Send to | The mail address that gets the report. |
| Time limit | 1 to 30 minutes, 5 by default. |
| Scope | Comprehensive runs the statement as a test and can recommend a SQL profile. Limited takes seconds. |
| Attach the script | Adds the advice as a .sql file. |
| Keep the task | Keeps the advisor task in the database after the run. |
A database runs one advisor at a time, with at most three runs that wait or run. Recent runs keeps the reports for 90 days. Scops applies no recommendation: examine the script and run it yourself.
Ask Scops AI
When Scops AI is set up, two buttons send the statement to it, only when you click them:
- Ask Scops, at the bottom of the sheet, analyzes the statement.
- Analyze Plan, in the plan header, analyzes the plan.
See the sessions that run it
Click Sessions at the bottom of the sheet. Live Activity opens, where you can kill a session.
Related
Updated November 3, 2026