Dashboard
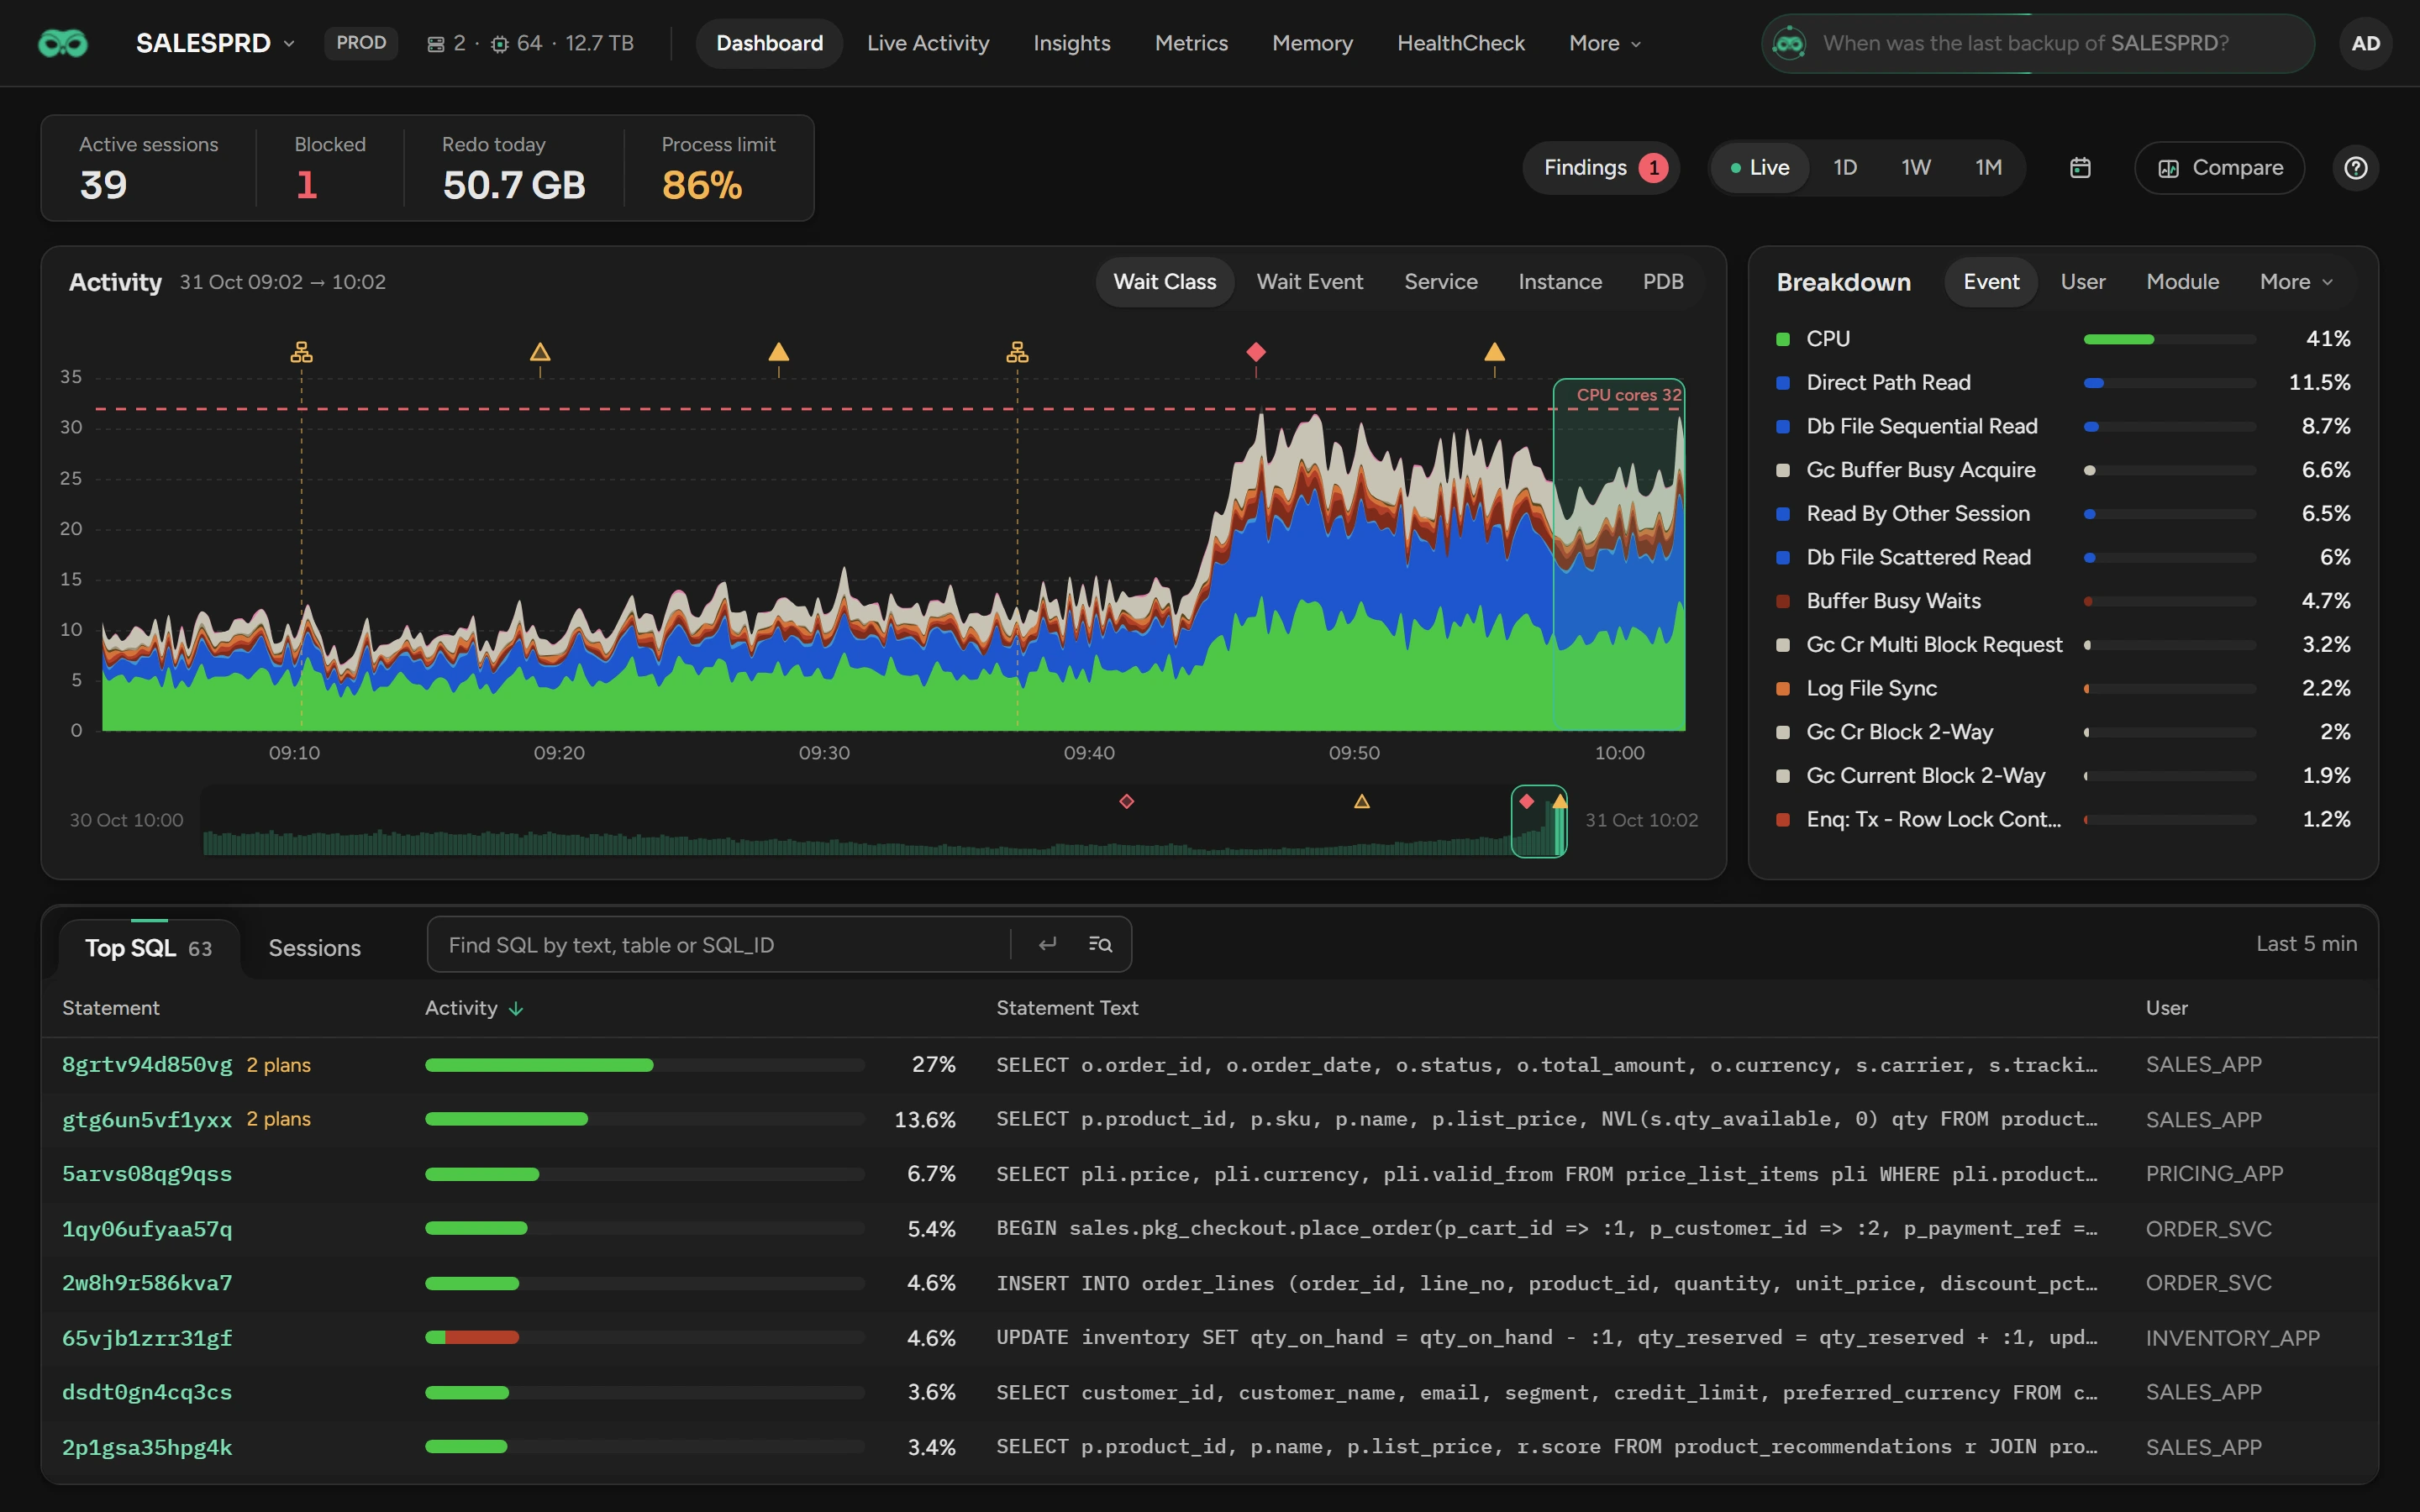
Use the Dashboard to see what one database does: its active sessions, their waits, and the busiest statements and sessions.
Before you begin
- You need the View Dashboard permission. Open the Dashboard from the Databases page or the database bar.
- The Dashboard needs no Diagnostics Pack. Scops keeps the session samples for 15 days by default (see Retention).
Read the values at the top

A value has a color only when it needs attention. Hover over it for the detail. Click it to open more.
| Value | What it shows | Click to open |
|---|---|---|
| Active sessions | The active sessions now. Amber from 85% of the sessions limit, red from 95%. | Live Activity |
| Blocked | The sessions that wait on a lock. Red when there is one. | The Blocking tab |
| Redo today | The redo archived today. A NOARCHIVELOG database shows —. | Archived per Hour and Log Files |
| Process limit | The use of the processes limit, for the RAC instance nearest to it or the CDB of a PDB. Amber from 85%, red from 95%. | The processes, sessions and PGA of each process |
Open the findings
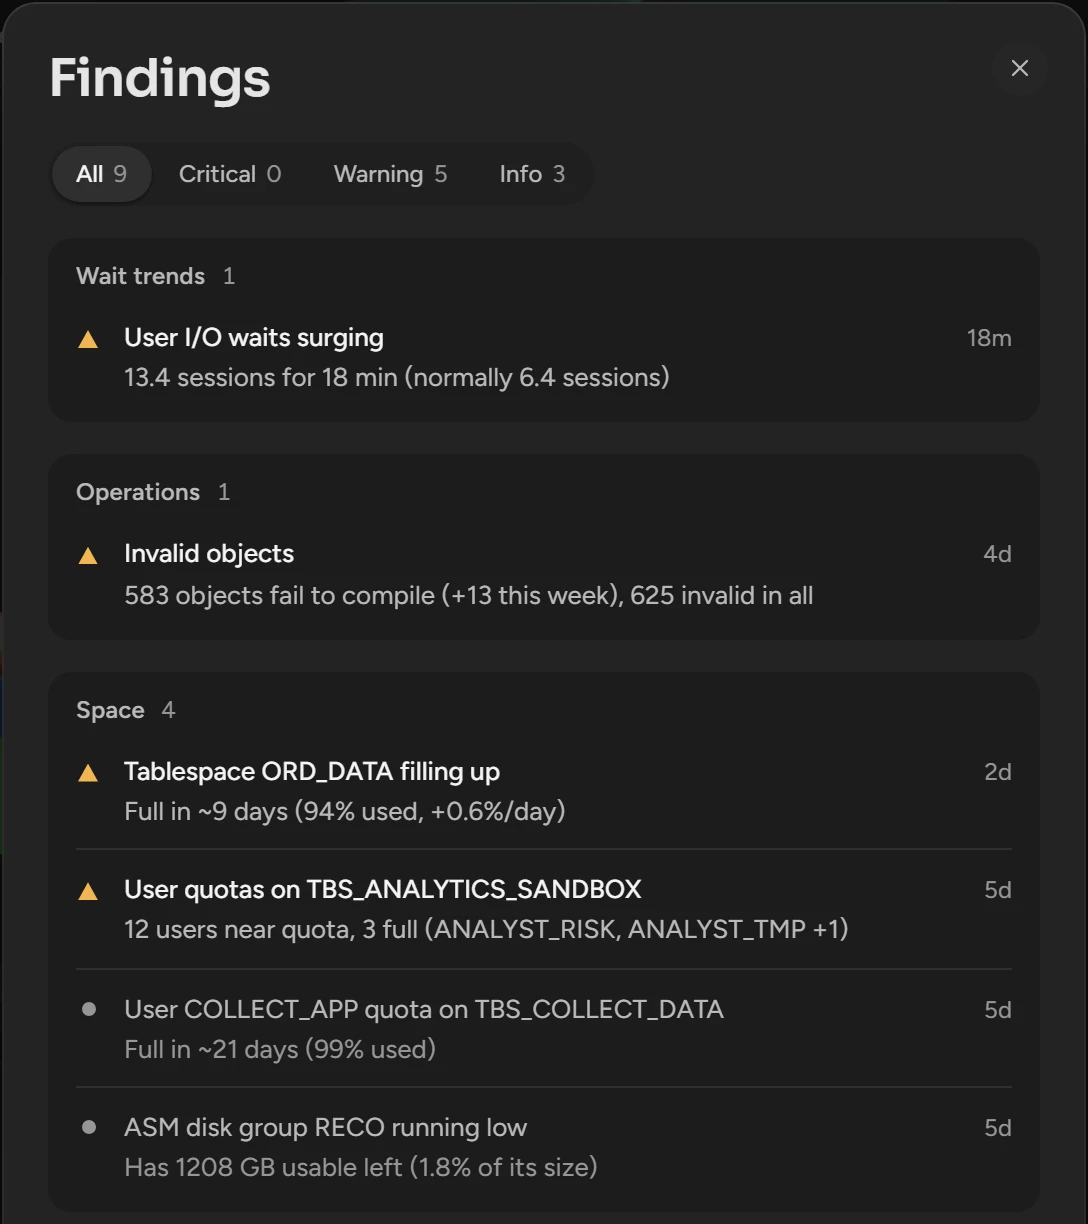
Click Findings next to the time buttons. The red number shows the critical findings. No number means that no open finding is critical. 0 means that there is no open finding, and the button does not open. A dash means that Radar Engine does not cover this database.
In the Findings panel, click a row to read the finding.
Alert log, in the footer of the panel, opens all alerts and findings of the database on Incidents.
Choose the time window
| Button | Window |
|---|---|
| Live | The last hour. The page refreshes every 15 seconds. |
| 1D, 1W, 1M | 24 hours, 7 days or 30 days, in hourly, 4-hour or daily bars. |
| Calendar button | Any range. Select From and to, then click Apply. |
To move the window, drag the box on the strip under the chart. All times use the clock of the database.
Read the Activity chart
The chart stacks the active sessions: user sessions on CPU or in a wait that is not idle. To change the split, select Wait Class, Wait Event, Service, Instance or PDB in the chart header.
| On the chart | Meaning |
|---|---|
| CPU near the CPU count of the database bar | The database is short of CPU. |
| A gap | Scops could not sample. A gap is not zero. |
| A status shape | Radar findings opened there. Point to it to see them. Click it to open the most severe one. An ended finding keeps its shape and color. A finding that reached Warning, and a key metric at a record hour, keeps its shape for the month. Other findings keep it for their first hour. |
| A plan icon | The plan of one or more statements changed. Shows in a window of one hour or less. Point to it to see the statements. Click it to open the one with the most database time. |
To see the activity of one statement or wait event on the chart, point to its row in Top SQL, or to an event in Breakdown. Its activity moves to the bottom of the stack in the accent color, and the other bands fade. The chart header shows its name.
Select a range
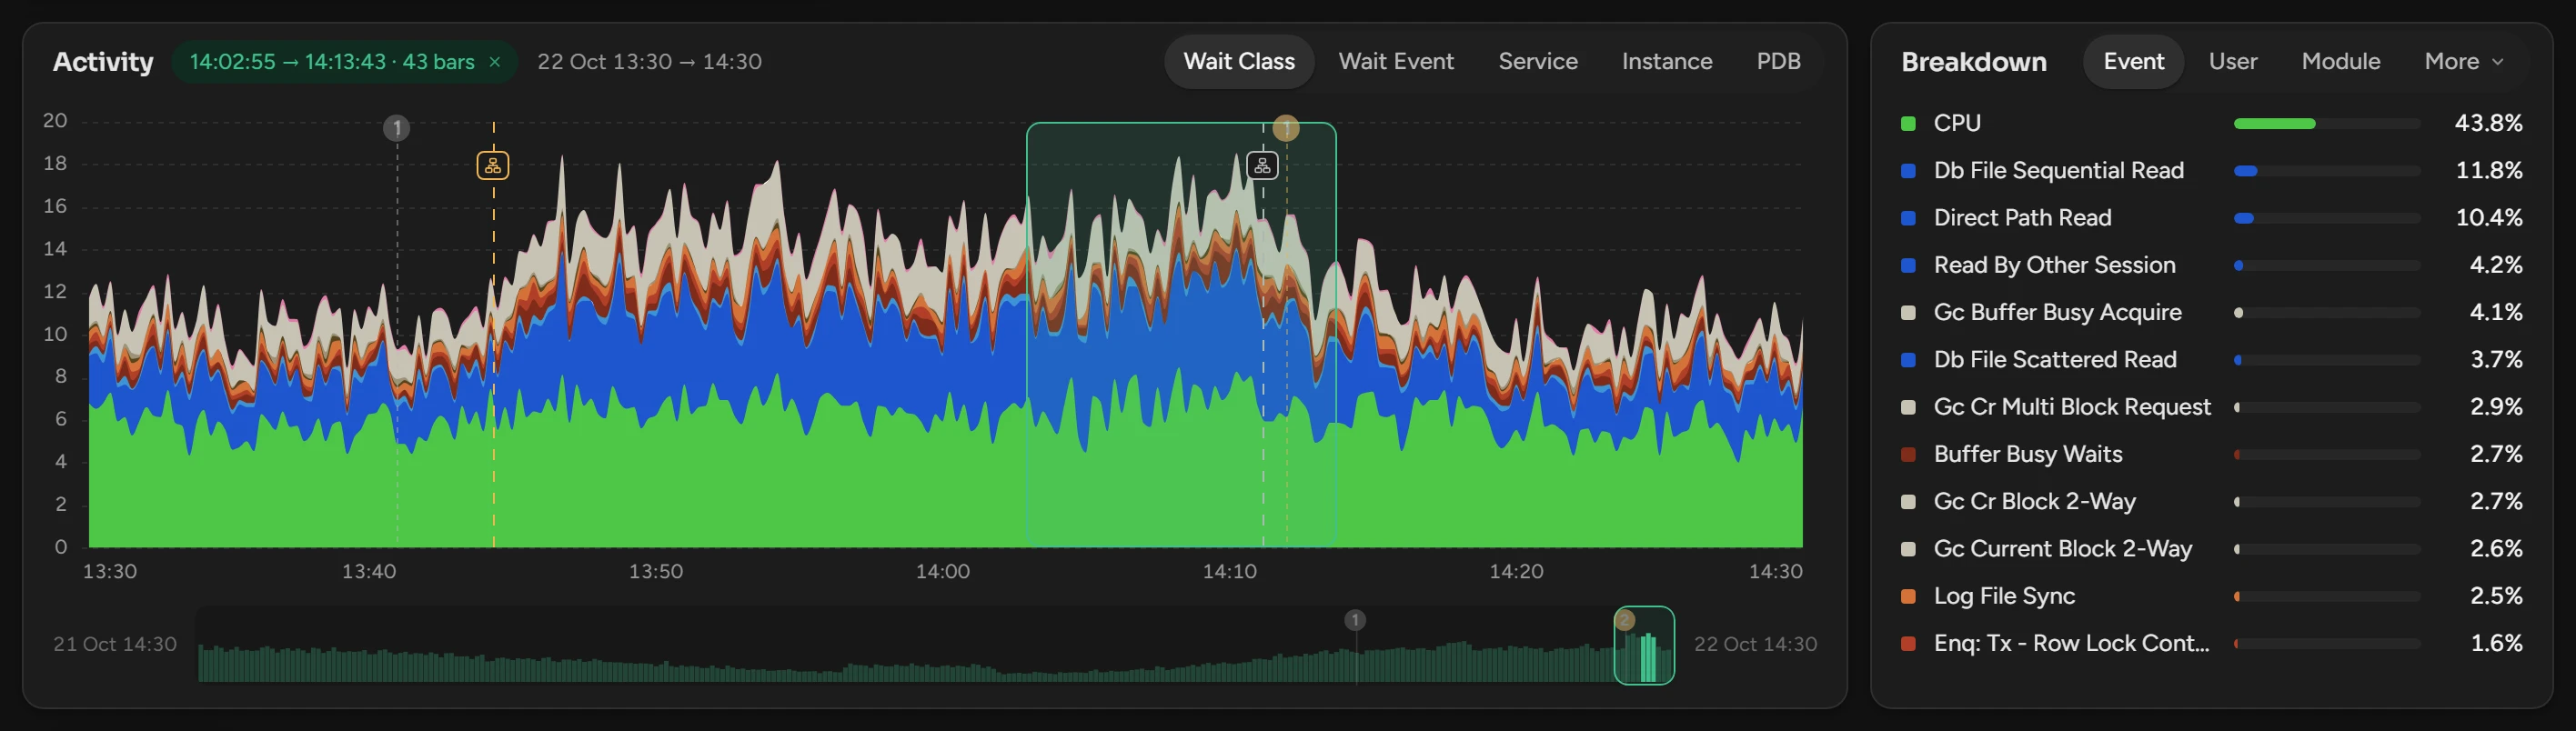
Drag across the chart. A chip in the chart header shows the range.
To clear the range, click the chip or Live.
The parts under the chart then show only that range. Without a range, they show the full window, or the last 5 minutes in Live.
Filter by event, user or module
In Breakdown, select Event, User or Module. More adds Machine, Program, Instance and PDB.
Click a row. Top SQL and Sessions show only its statements and sessions.
To show all rows again, click the chip beside the list.
Find the busiest statements
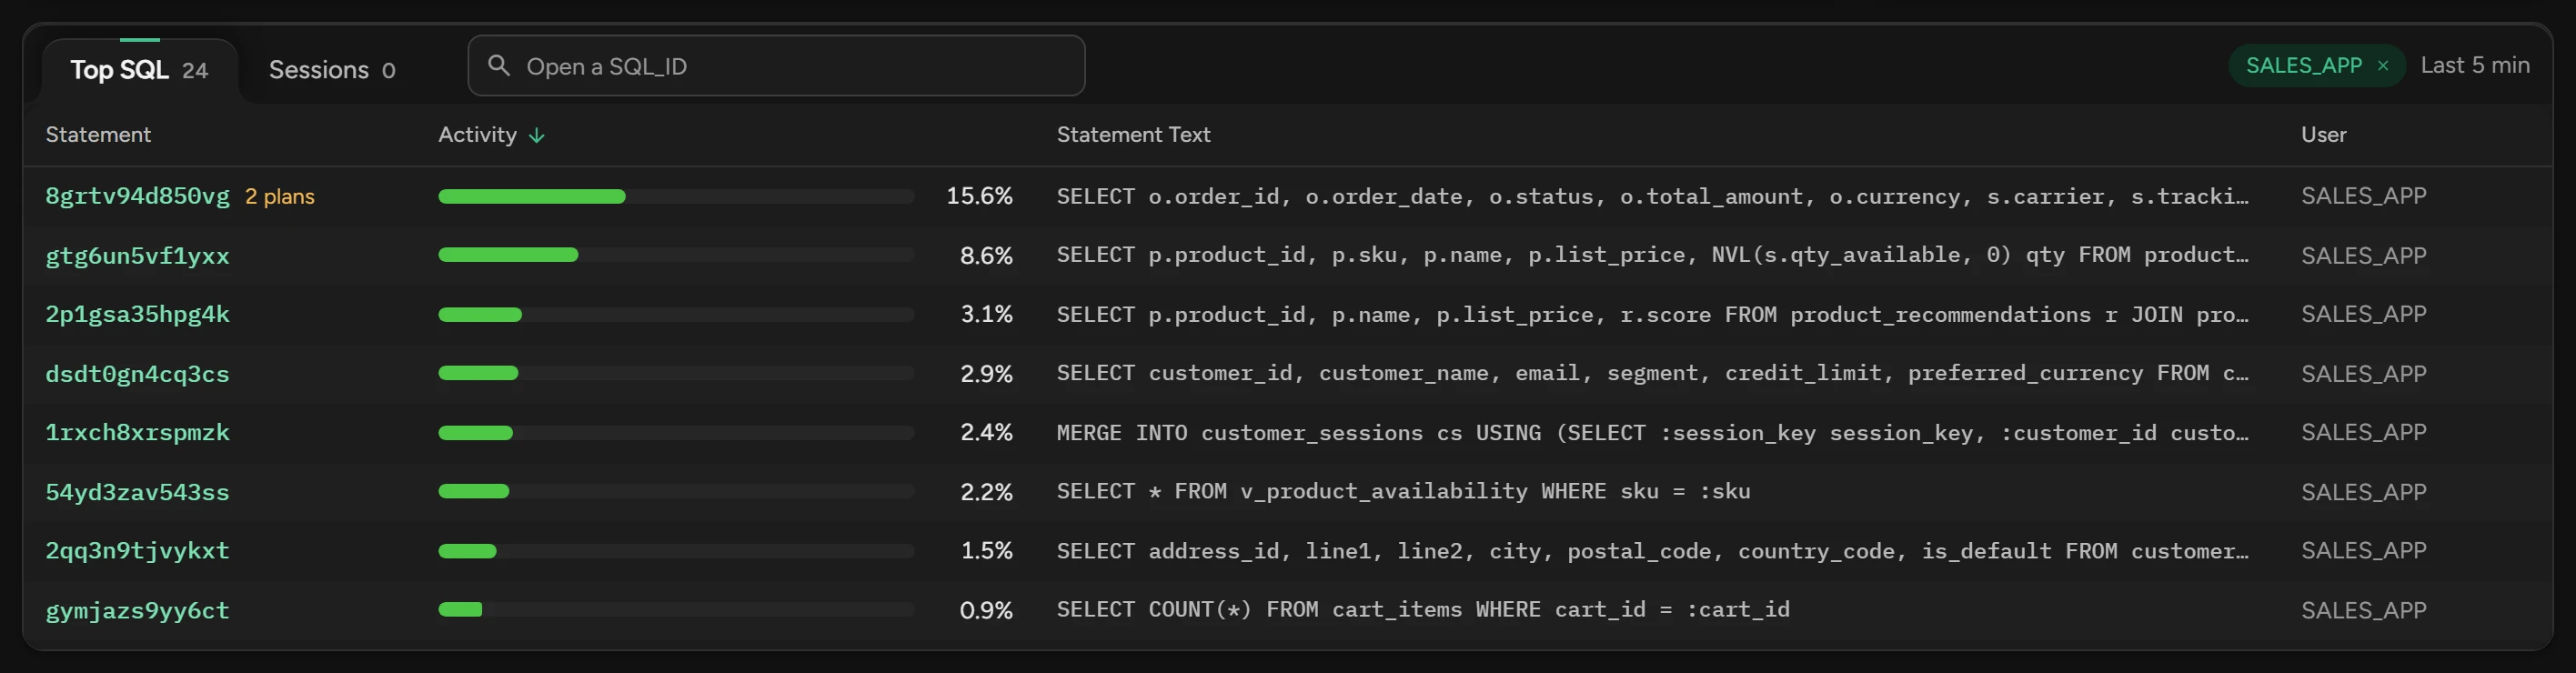
The Top SQL tab lists the statements of the range, the busiest first.
| Tag | Meaning |
|---|---|
| ×4 | A parallel run, and its degree. |
| 2 plans | The statement used more than one plan. |
| text not captured yet | Scops captures the text, usually in a minute. |
When the window is older than the raw samples, sessions, plans and the parallel degree do not show.
Find the busiest sessions
The Sessions tab lists the sessions of the range as instance/SID, with their busiest wait and SQL_ID. A red blocked tag means that the session waited on another session. Click a session to open its details.
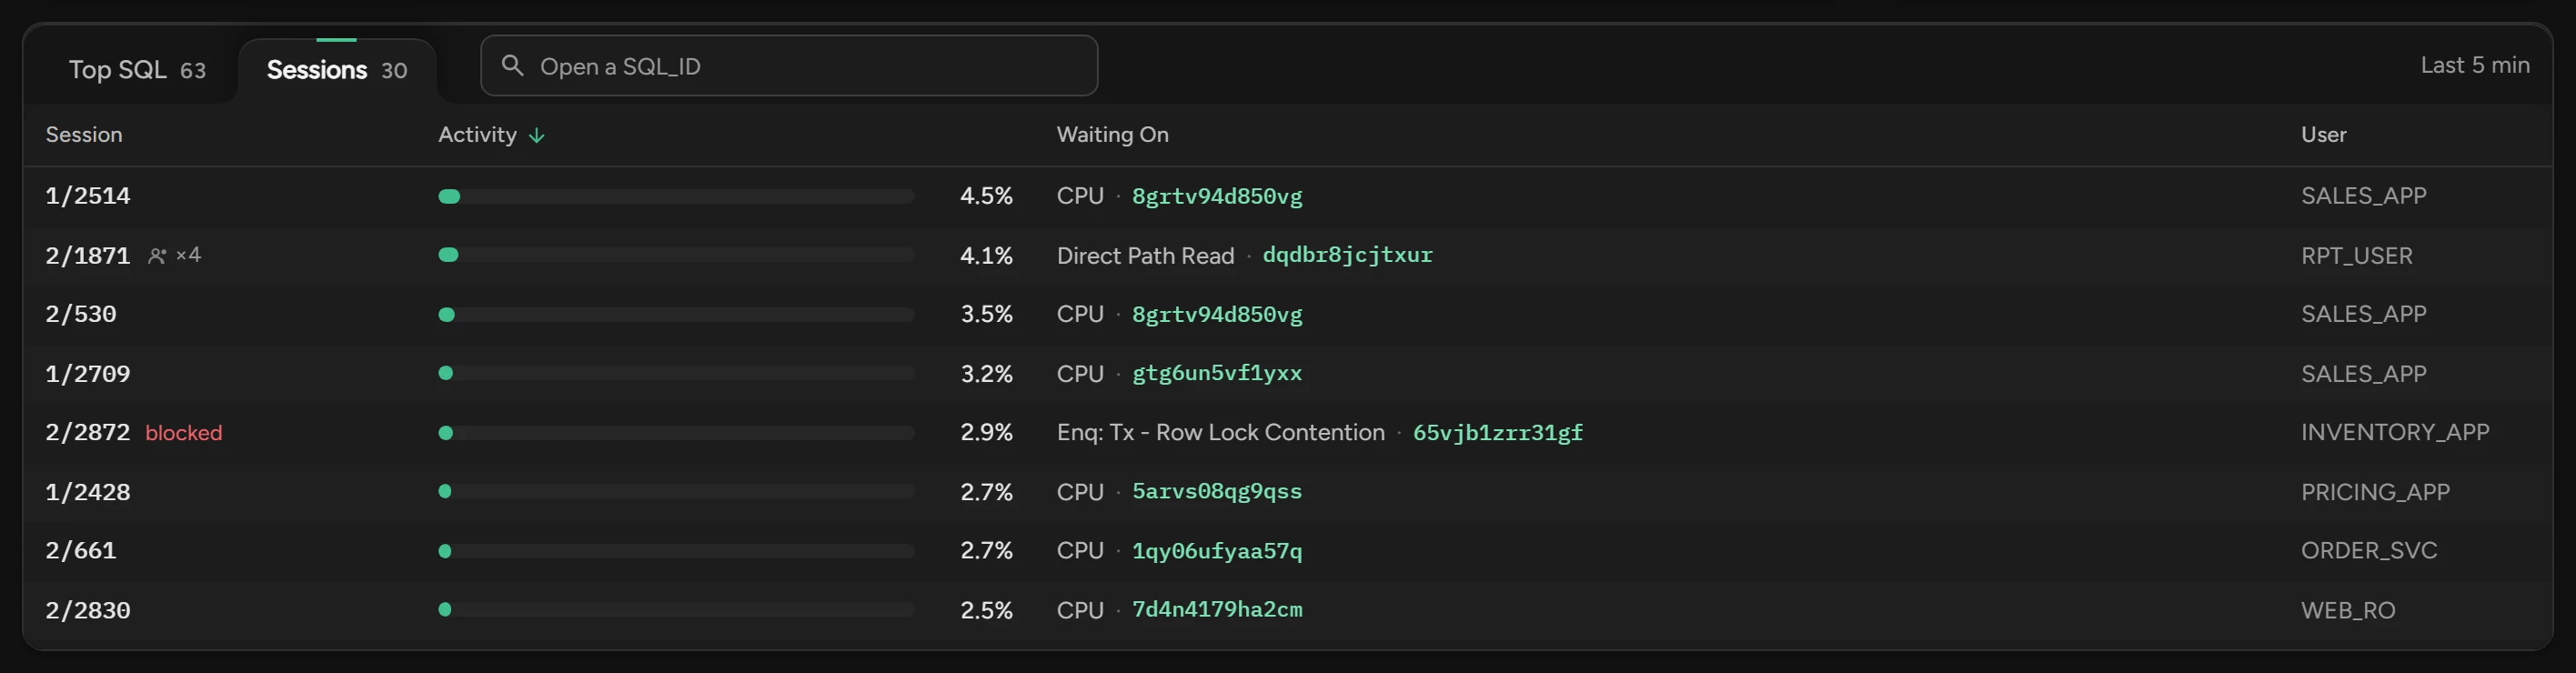
Open or find a statement
- Click a SQL_ID. Its SQL details open for the same range.
- Or type a SQL_ID in the box next to the tabs and press Enter. The Open SQL_ID button in the box does the same.
- To find statements by a piece of their text, or by a table or index, type it in the box and press Enter, or click Find SQL. The Find SQL window opens with your text in its box. Click Search to start the search.
Compare two ranges
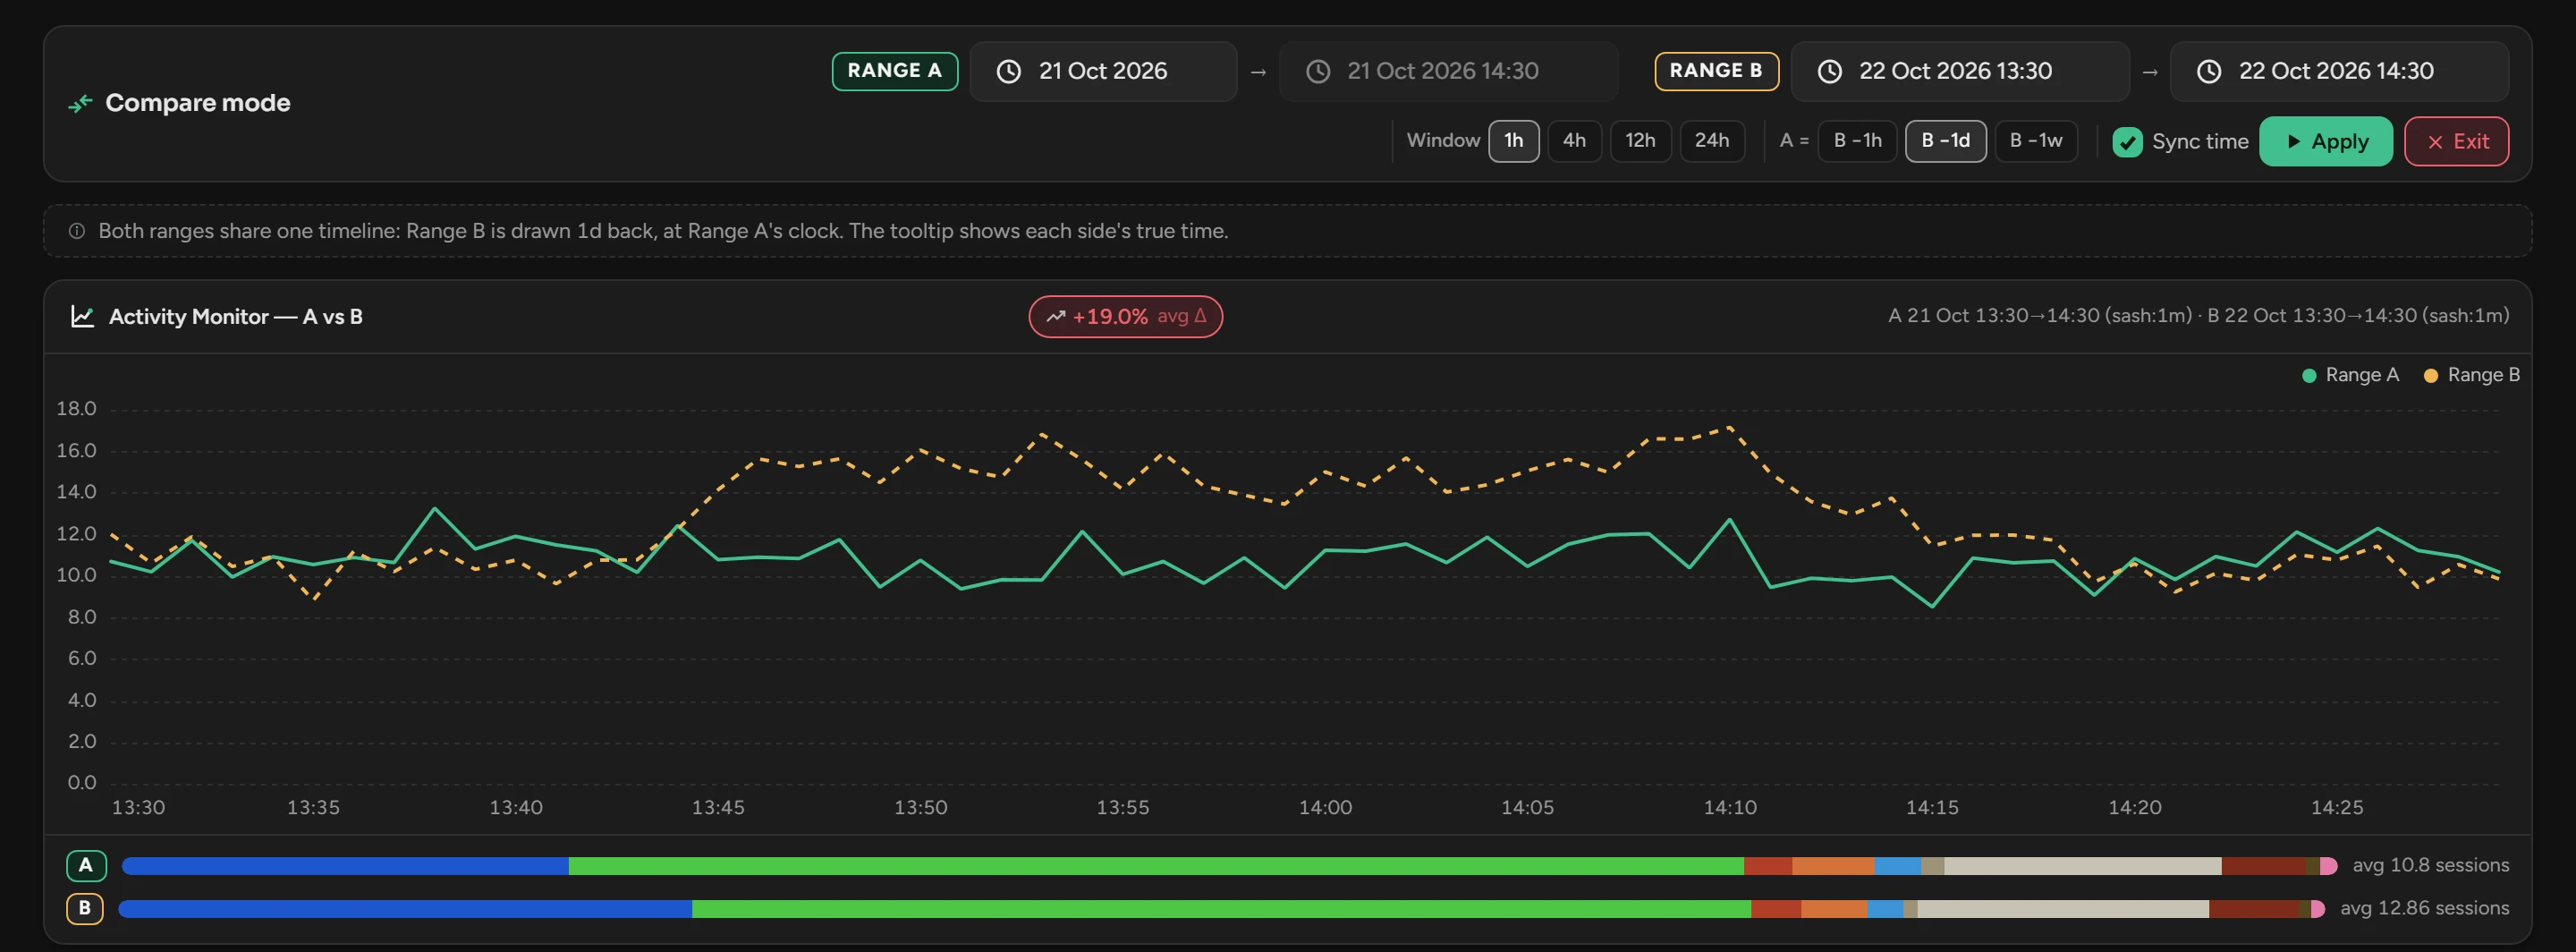
Click Compare. Range B is the last hour, and Range A is the same hour one day before.
Set the length of B with Window: 1h, 4h, 12h or 24h.
Set A with A =: B −1h, B −1d or B −1w. With Sync time on, you select only its day.
If you changed a date, click Apply.
To go back, click Exit.
Range A is a solid line and Range B is dashed. Each range has its own Top SQL list.
Related
Updated November 10, 2026