Services
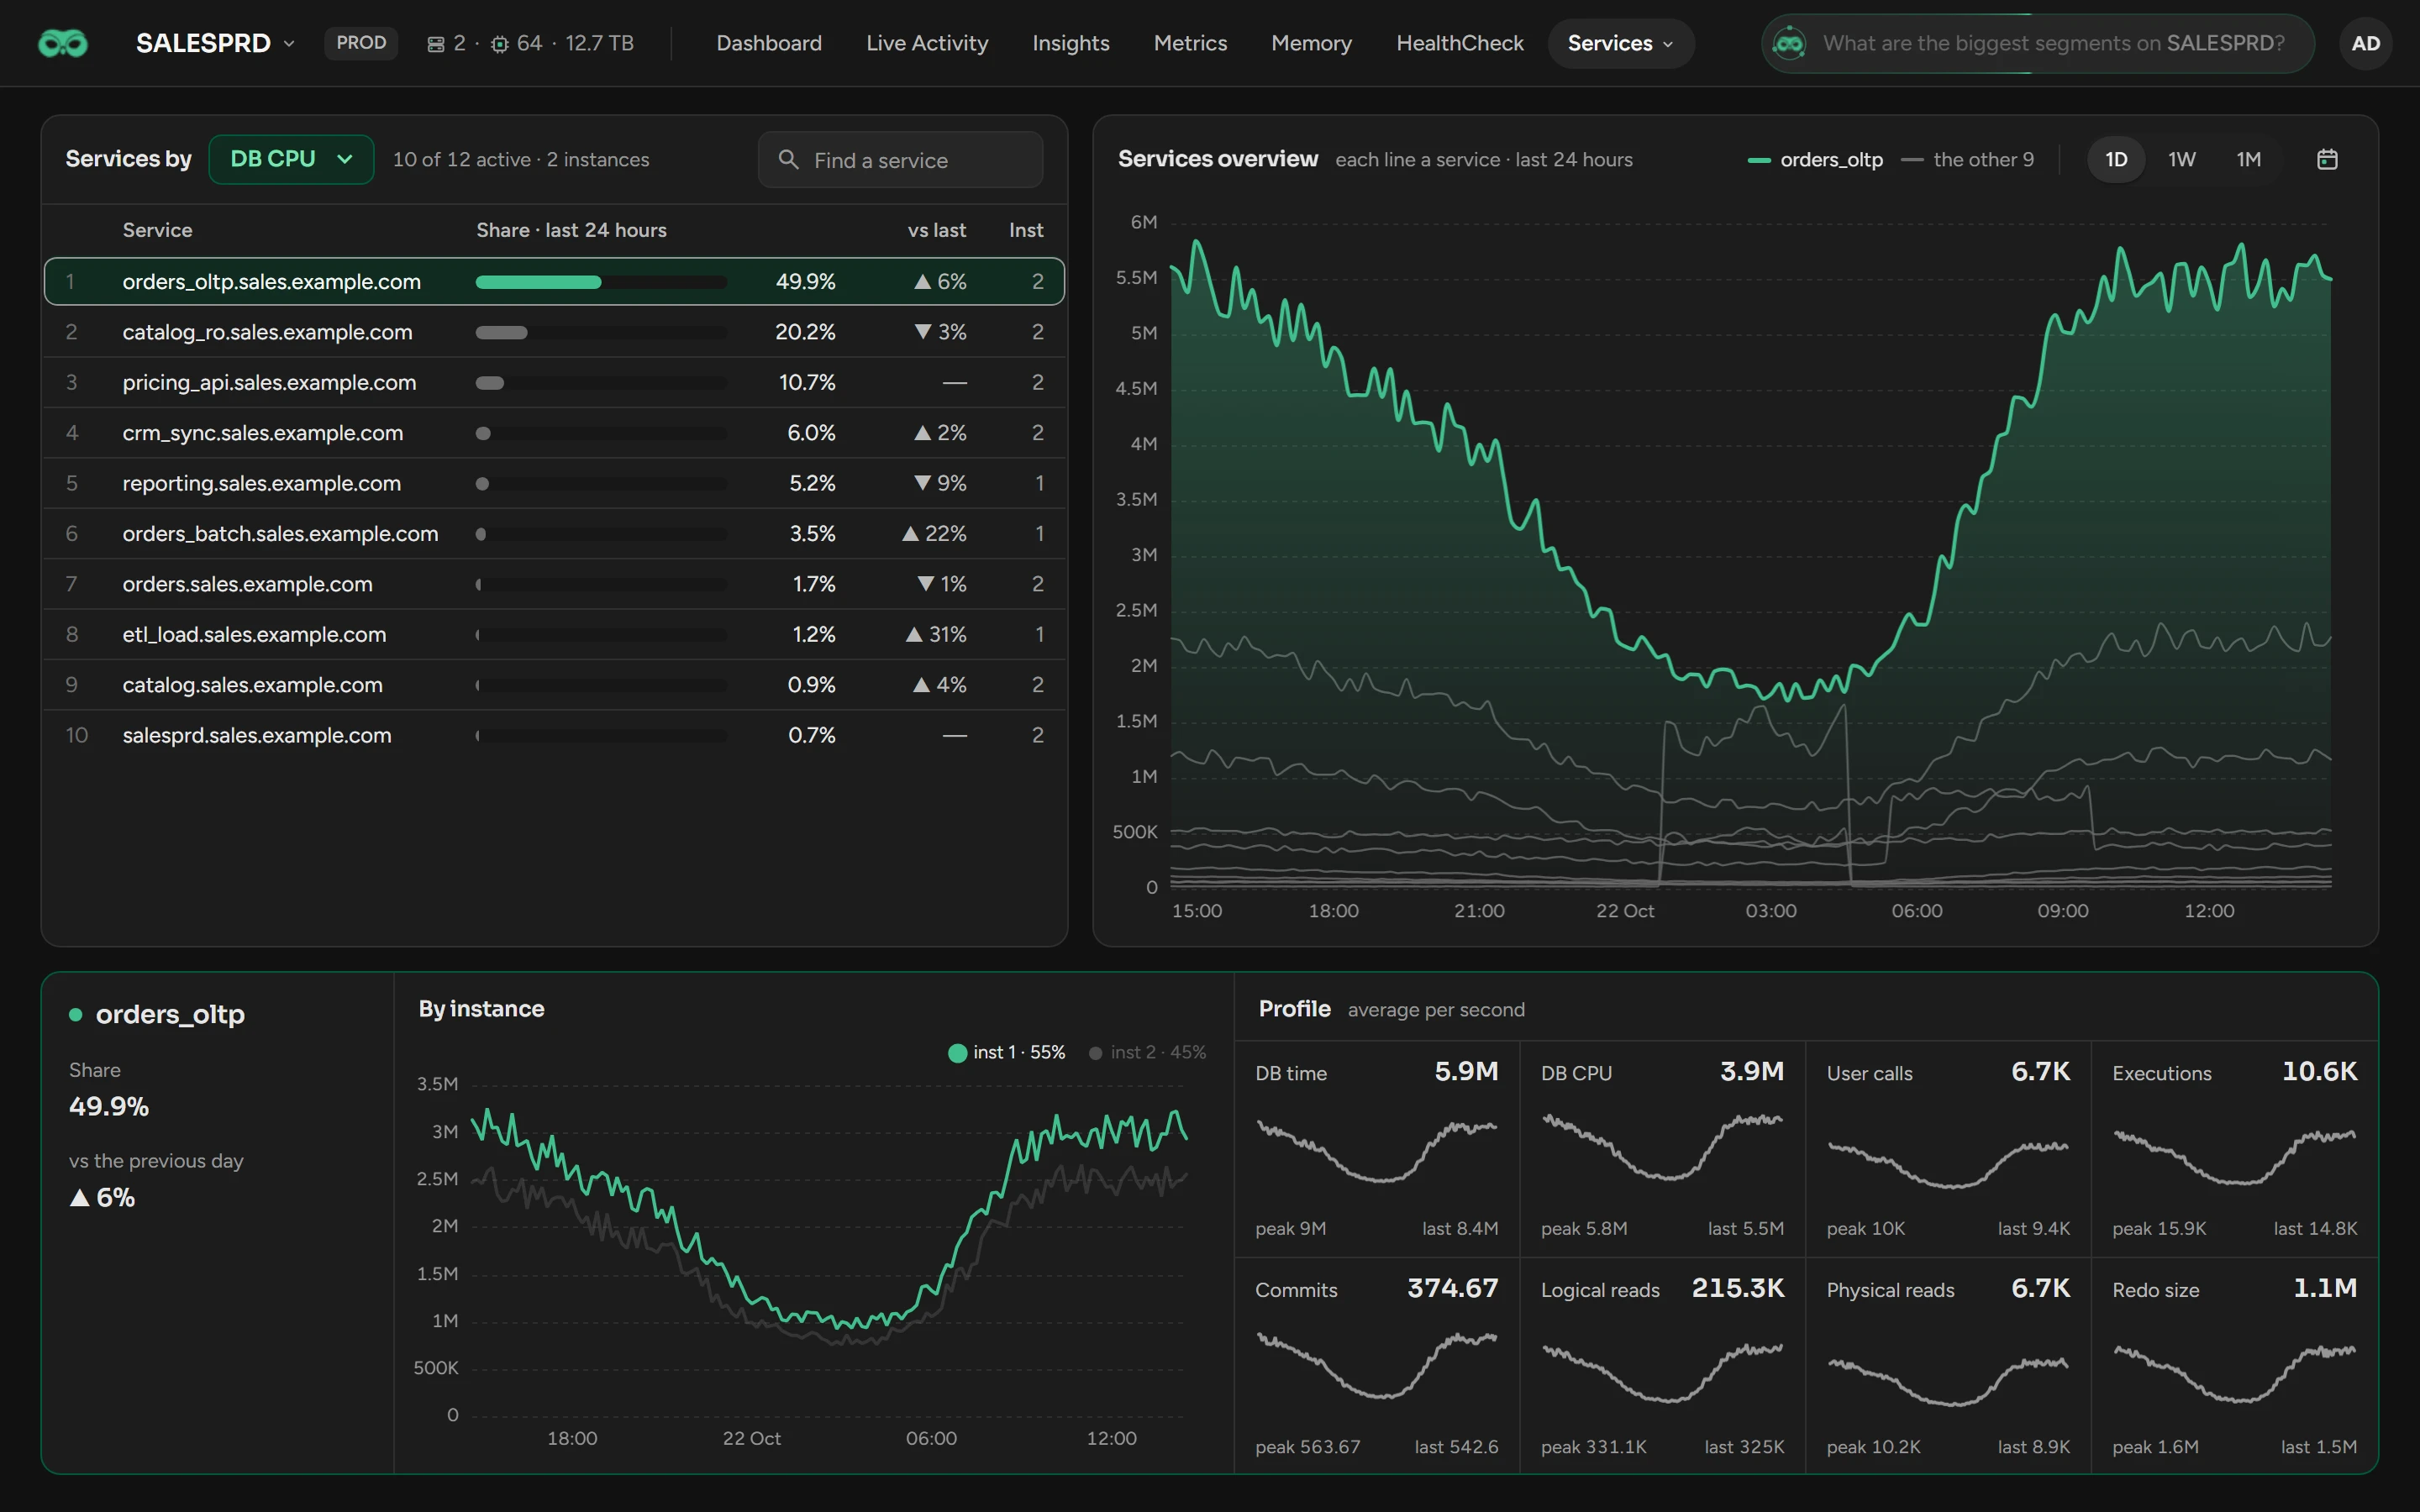
Use Services to find which database service carries the load of one database, and how one service behaves on each instance.
Before you begin
- You need the View Services permission.
- Scops keeps the service statistics for 90 days by default, 15 days in the Community edition. The page does not show SYS$USERS, SYS$BACKGROUND and the XDB services.
Choose the window
On the Services overview card, click 1D (the default), 1W or 1M, or select up to 31 days with the calendar button. When you hover over the overview, the By instance chart shows the same time.
Rank the services
In Services by, select DB CPU (the default), DB time, user calls or another statistic. The busiest service is first.
To filter the list, type in Find a service.
To show all services, click the last line of the list, for example "6 more services · 1.4% together".
Share is the part of the service in the window, and vs last its change against the previous window. Times are in microseconds per second: a DB CPU of 3.9M is about four busy CPUs.
Examine one service
Click a service. The card at the bottom shows:
- By instance: the part of each instance, for example inst 1 · 55%. Use it to find a service that is not balanced across RAC.
- Profile: eight tiles, such as DB time, Executions and Redo size, with the average per second, the peak and the last value.
Related
Updated October 30, 2026