Logs
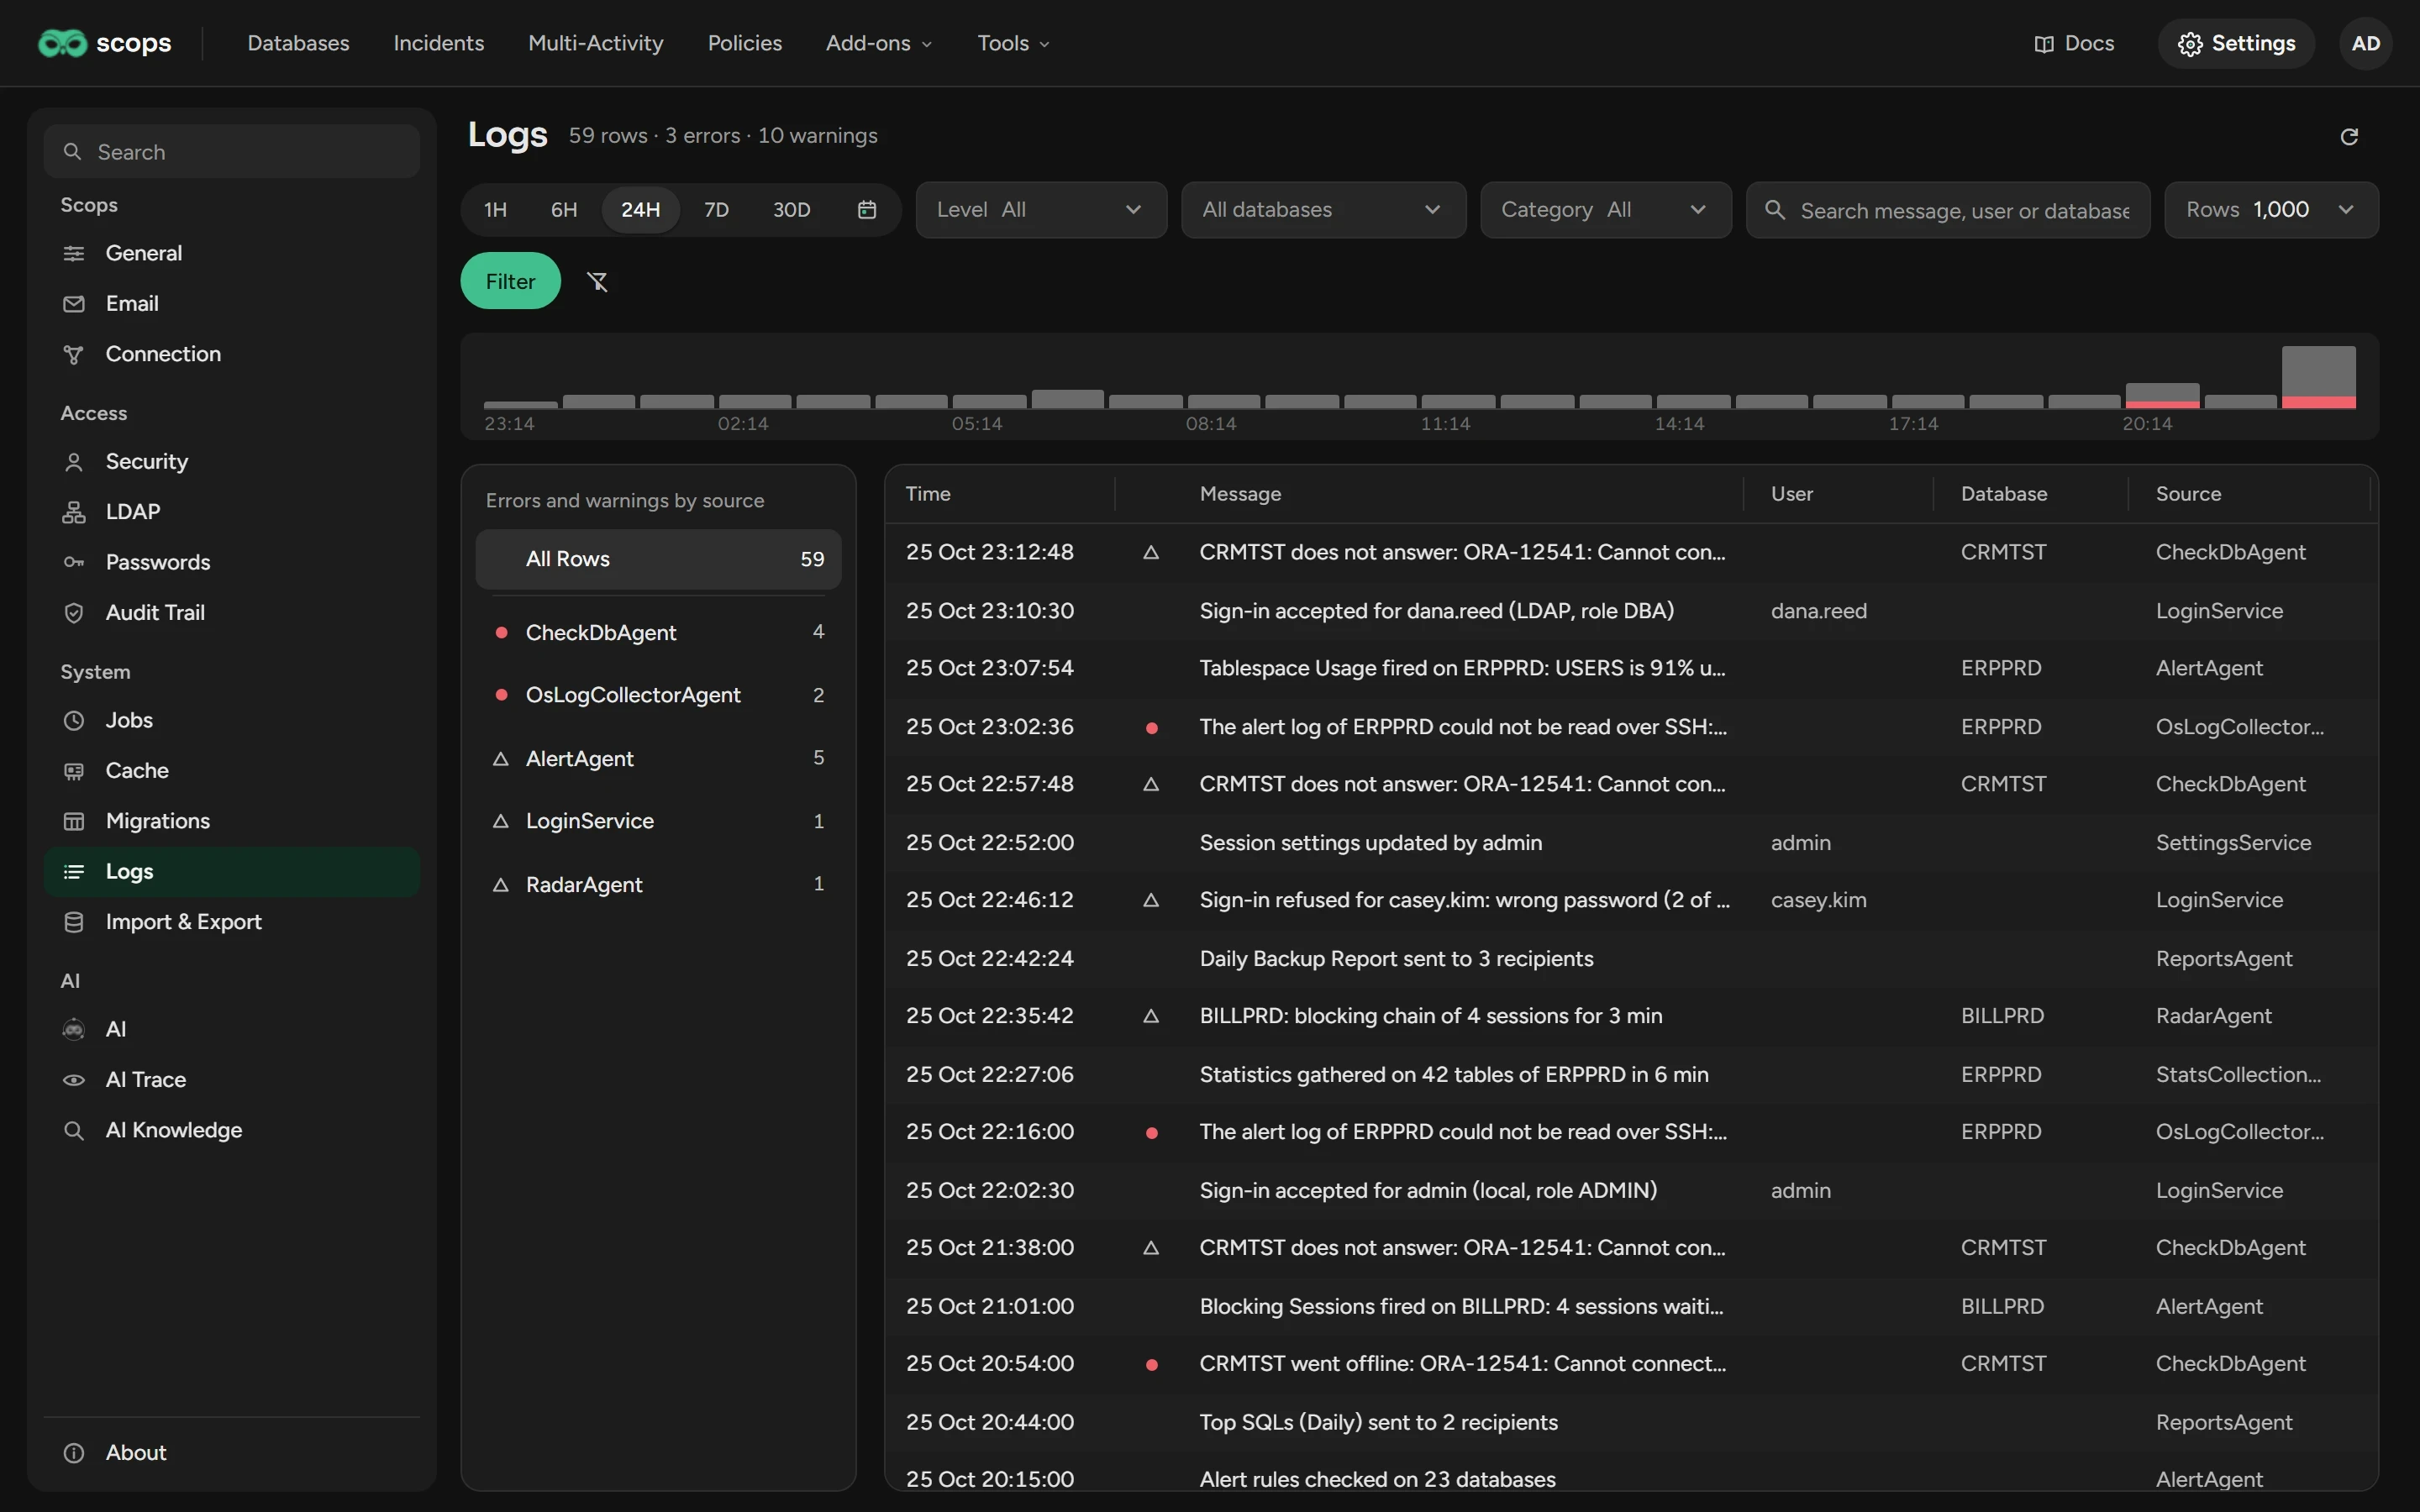
Find the errors and warnings of Scops, each sign-in with its real reason, and each change made in Scops.
Before you begin
- You need Manage Settings.
- This page reads the repository. To see why a service did not start, read the log files on the server.
Read the log
Open Settings › Logs.
Set the filters below, then click Filter.
To read one time, click its bar in the strip. To read one source, click it under Errors and warnings by source.
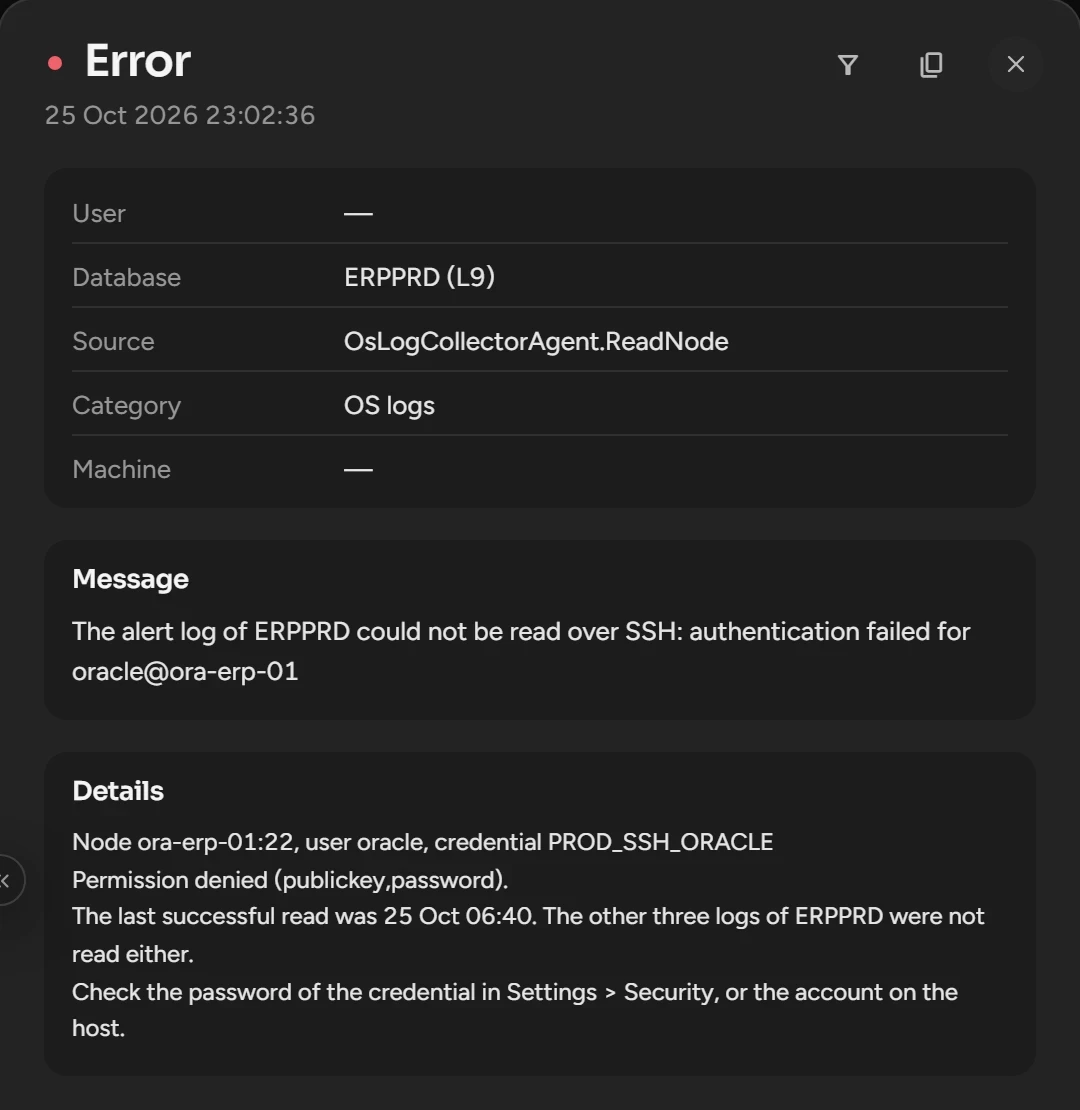
Click a row to see its full message and details.
| Filter | What it does | Default |
|---|---|---|
| Window | 1H to 30D, or a date range, by the repository clock. | 24H |
| Level | Fatal, Error, Warn or Info. | All |
| Database | One database. | All databases |
| Category | The part of Scops that wrote the row. | All |
| Search | A word in the message, user, database, source or category. | Empty |
| Rows | 500, 1,000 or 5,000. "1,000+" means that more rows match. | 1,000 |
Categories
| Category | What it holds |
|---|---|
| Sign-in | Each sign-in attempt, with the real reason of a failure. |
| Audit | Each change made in Scops, with the user and the machine, also refused requests and the Audit Trail checks. |
| Multi-SQL | Each run on Multi-SQL: who, the statement, the databases and the result. |
| Database check | Databases that stop or start to answer. |
| Jobs | Runs, restarts and stuck work of the jobs. |
| Page visits | The pages that users opened. |
The other categories, such as Alerts, Reports or Migrations, hold the work of the feature with that name.
Related
Updated October 31, 2026