Incidents
Find, open and clear the alerts of your databases, and open their Radar findings, on one page.
Before you begin
- The Alerts grid needs View Incidents. The Radar grid needs View Radar.
- To clear alerts, you need Clear alerts.
- A user limited to one group sees only the alerts of that group.
Filter the grids
| Control | What it does |
|---|---|
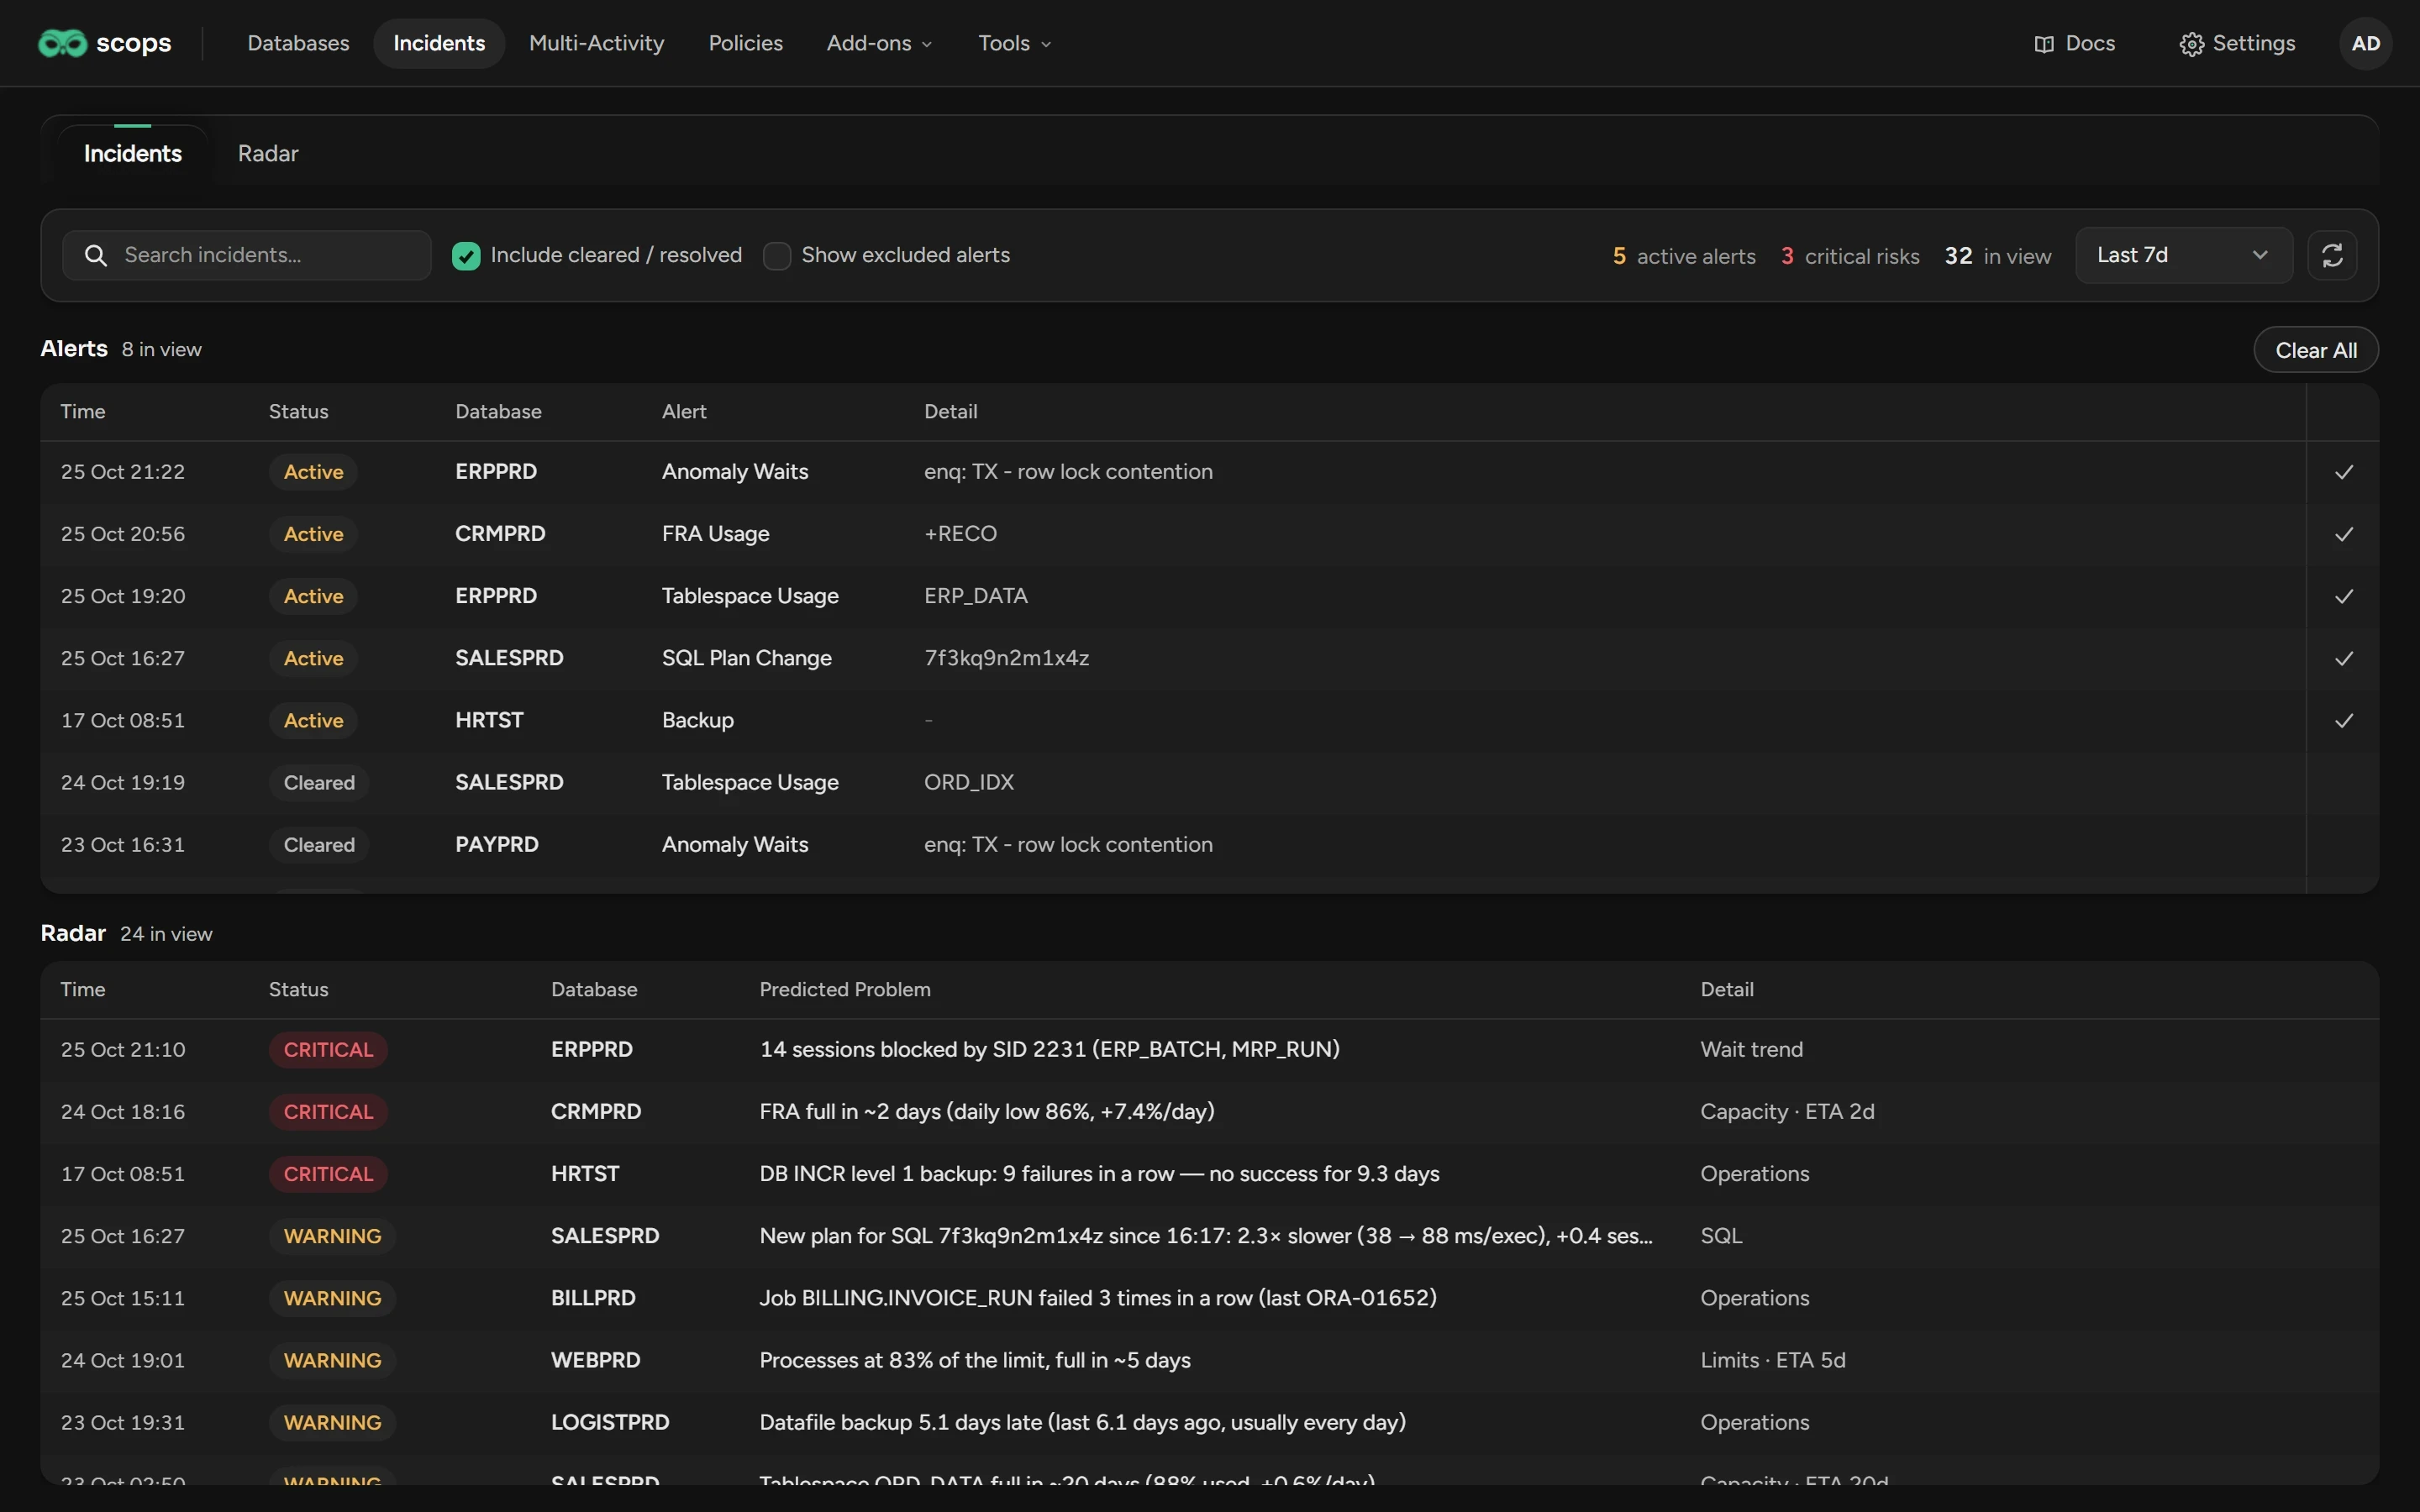
| Search incidents | Filters both grids by name, database or detail. |
| Include cleared / resolved | On by default. Turn it off to see only open items. |
| Show excluded alerts | Adds the muted and excluded Radar findings. |
| The time window | Last 7d by default. Open findings always show. |
On the Dashboard, Alert log opens Incidents for one database.
All times use the clock of the database.
Open an alert
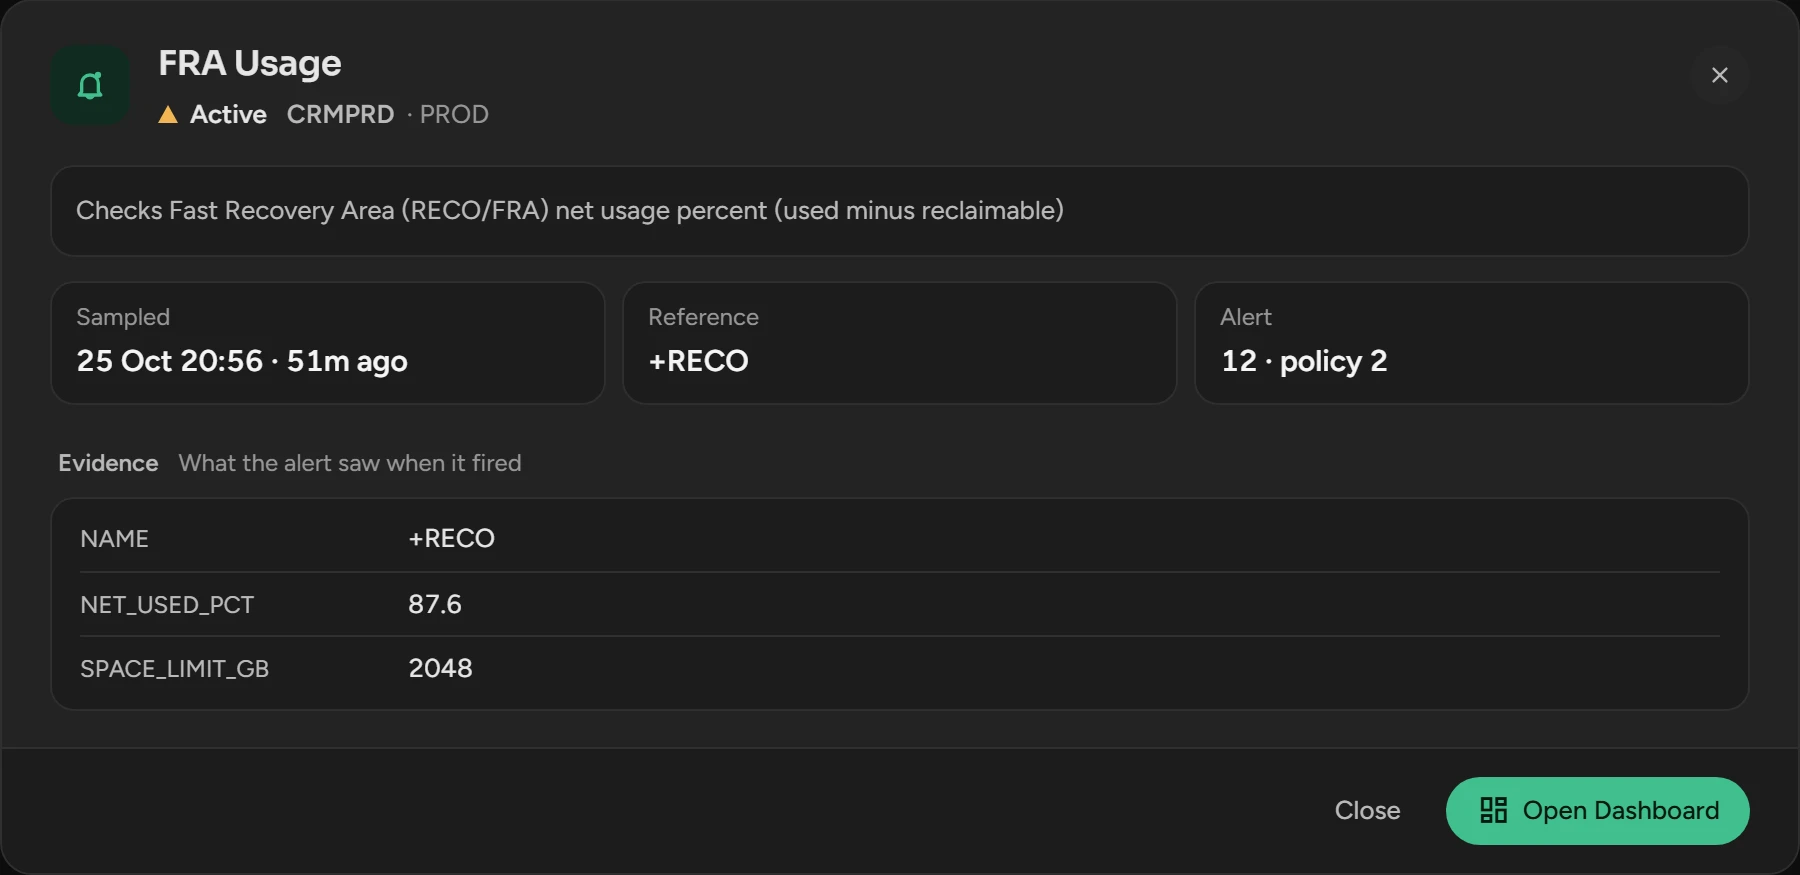
Click a row in the Alerts grid. The dialog shows what the rule checks, the policy and the Evidence: the rows that the rule saw.
Clear an alert
Click the check mark at the end of the row, or Clear All for all active alerts in view.
Click Clear. If the rule sends traps, Scops also sends a clear trap.
If the problem continues, the next check raises the alert again. To stop it, change the rule or add an exception.
Open a Radar finding
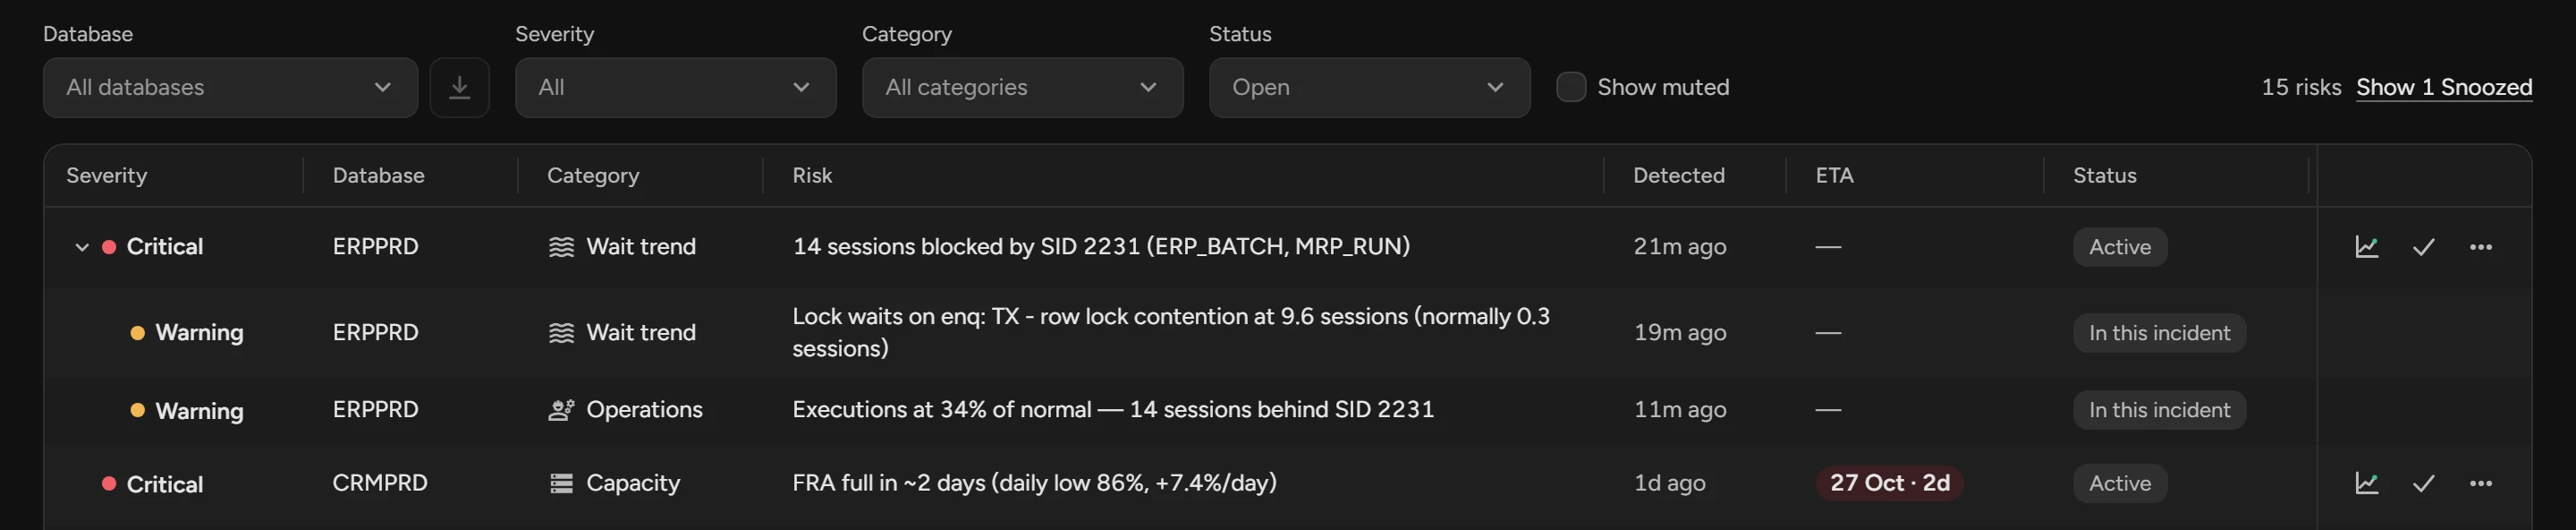
Click an open finding in the Radar grid. The finding dialog opens.
What you see
Alerts, findings and incidents
- Alert
- An alert rule found its condition. The alert is Active until the condition stops or a user clears it.
- Finding
- A risk that Radar Engine finds itself, now or in the future. It ends when the condition stops.
- Incident
- On this page, an alert or a finding. On the Radar tab, one problem that several detectors see.
The Alerts grid
Each row shows the time, the status (Active or Cleared), the database, the alert and its detail. An alert on shared infrastructure, for example one disk group, is one row: BILLPRD +3 more.
The Radar grid
Each row shows the time, the status, the database, the Predicted Problem and its detail, for example Capacity · ETA 2d. The status is the severity, with Ack or Snoozed if a user handled it, or the reason for an ended finding.
If Scops cannot read the alerts or the findings, a banner says so. Then an empty grid does not mean that nothing occurred. Click Retry.
Related
Updated November 9, 2026