Live Activity
Use Live Activity to see the sessions of one database now, find who blocks whom, and kill a session.
Before you begin
- You need the View Live Activity permission. Open the page with Live Activity in the database bar, or click Active sessions or Blocked on the Dashboard.
- To kill a session, you need Kill sessions, and the monitoring account needs the
ALTER SYSTEMprivilege (see Database user privileges).
Find a session
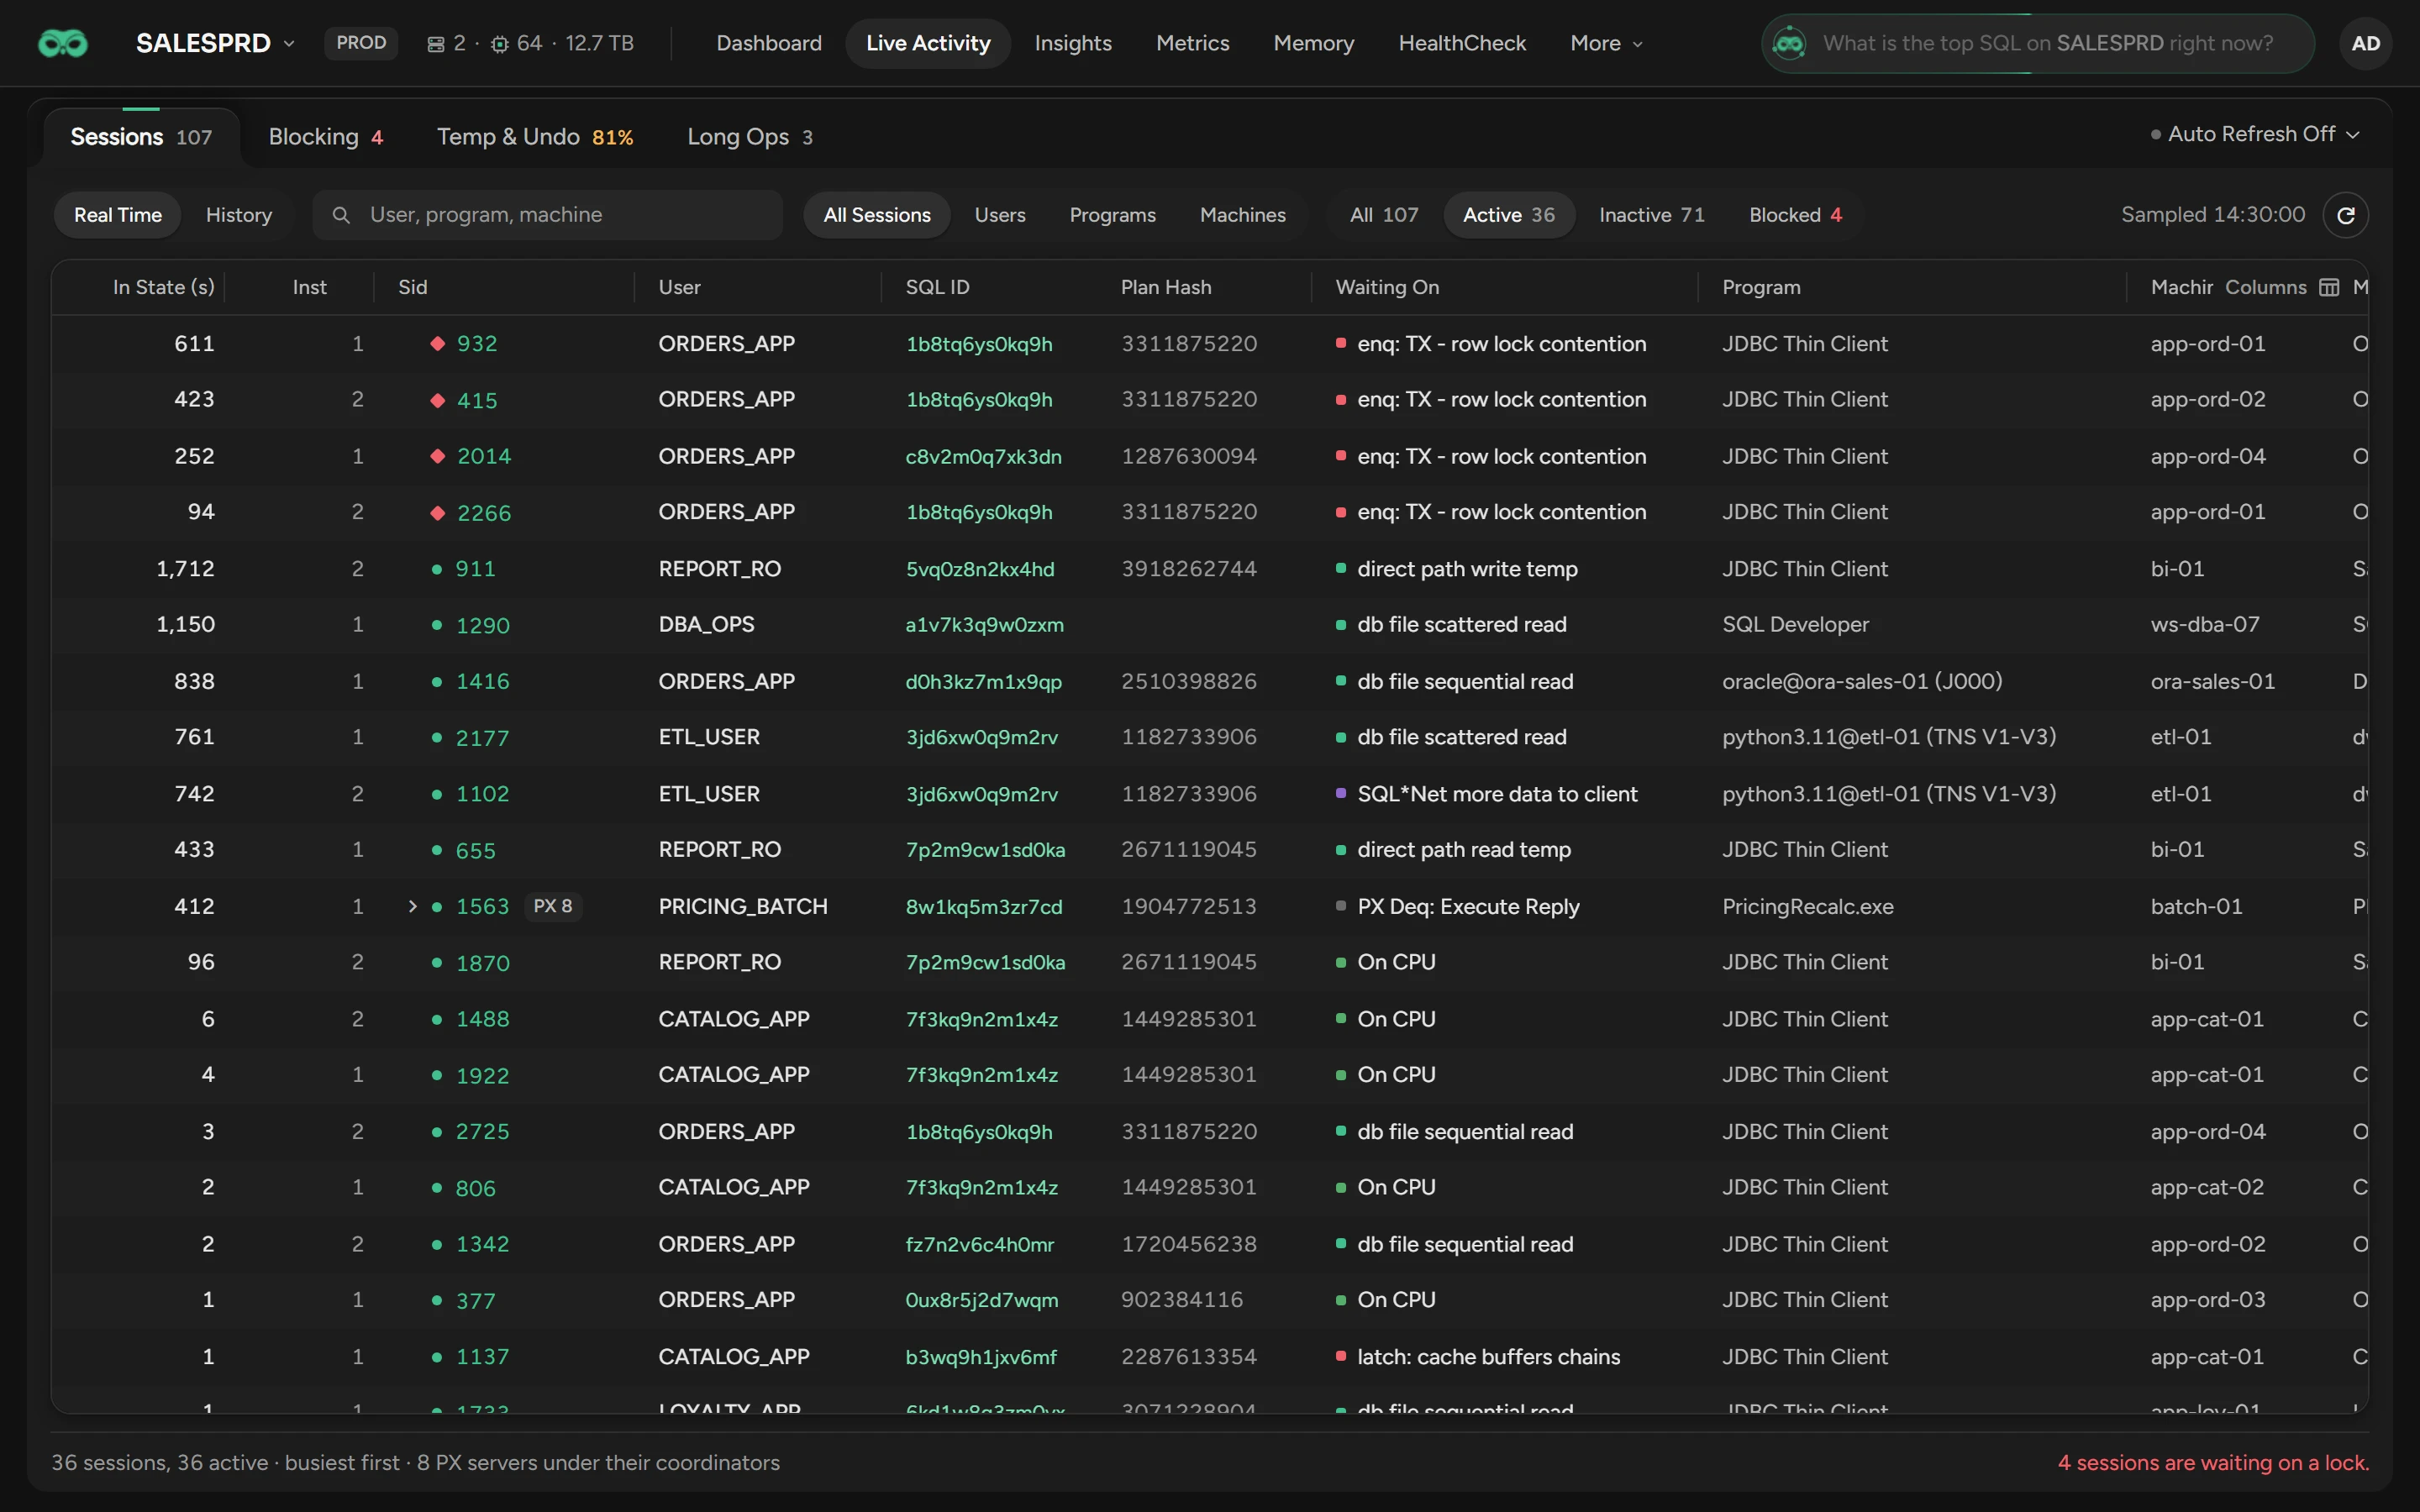
The Sessions tab lists the user sessions now, the busiest first.
Select a filter: All, Active (the default), Inactive, Blocked or, during a rollback, Killed.
To find a user, program, machine, module or service, type in the search field.
To group the sessions, click SQL IDs, Users, Programs or Machines. SQL IDs puts the statement with the most active sessions first. Click a group to show its sessions. All Sessions shows the flat list again.
To add columns, such as Blocked By, click Columns. Click Save to keep your choice.
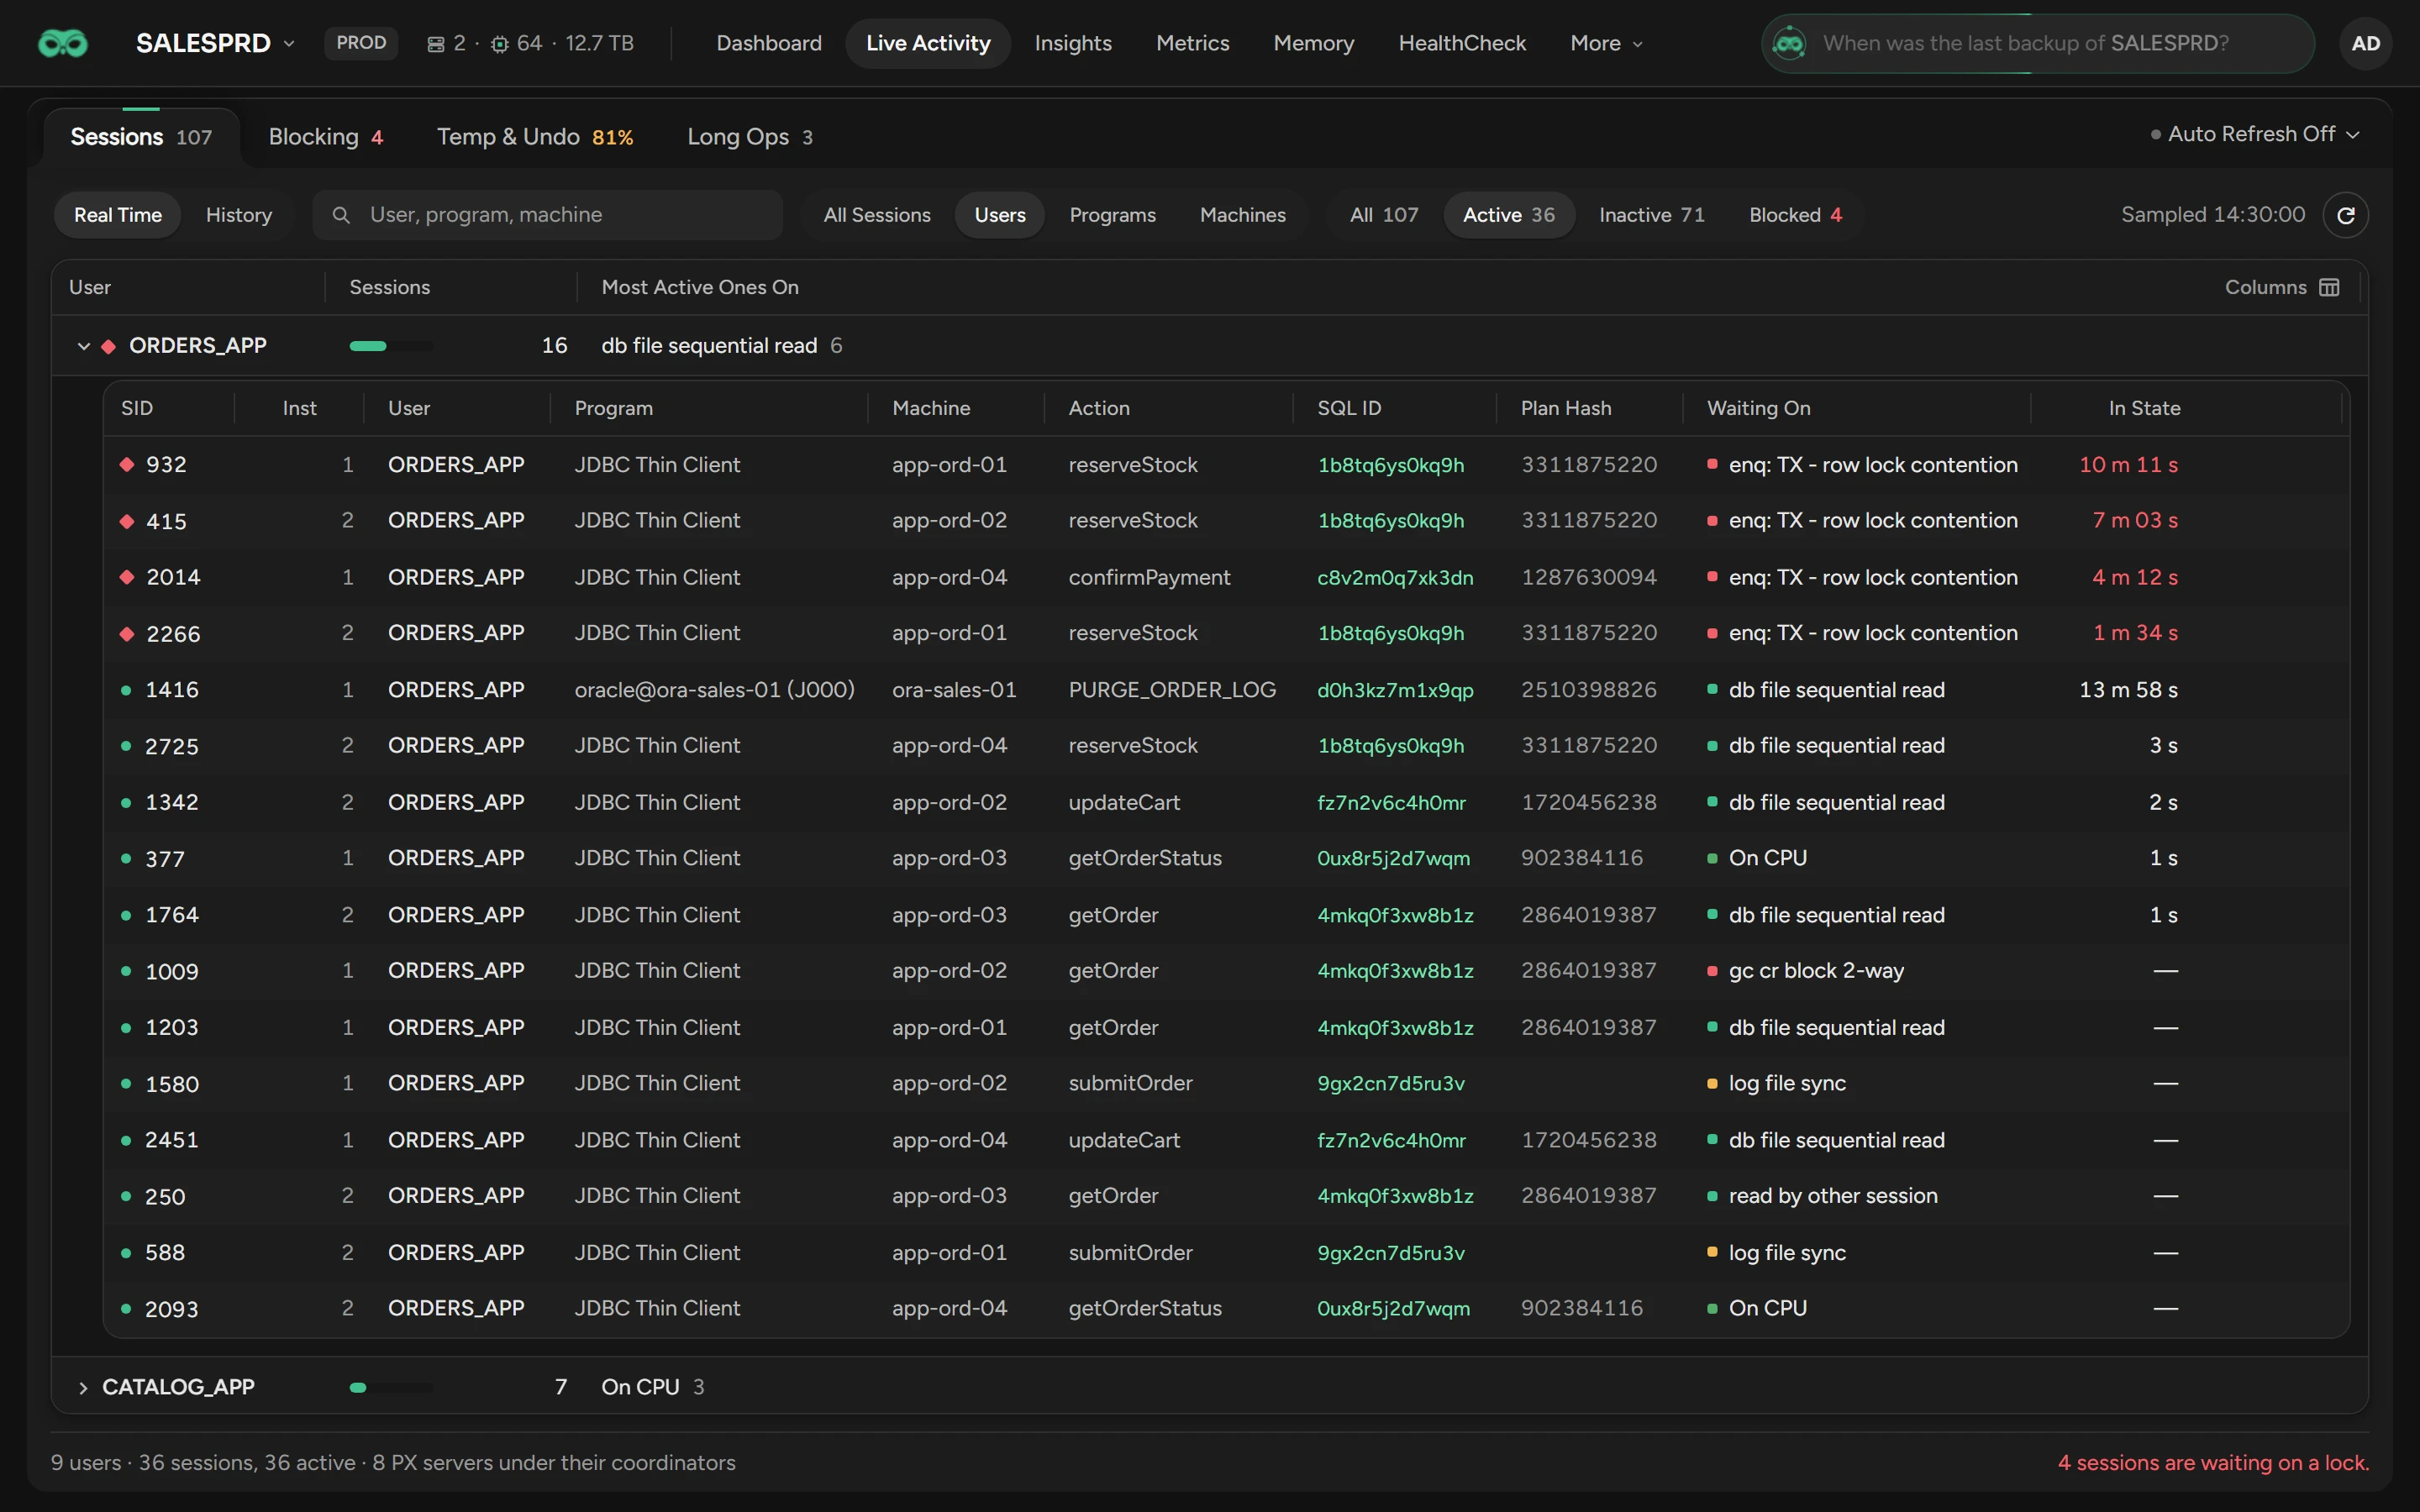
What the marks mean
| Mark before the SID | The session is |
|---|---|
| Green dot | Active: it runs a call. |
| Hollow ring | Idle: connected, but it does nothing. |
| Amber triangle | Idle in an open transaction, with its locks and undo. Or killed, and its rollback continues. |
| Red diamond | Blocked: it waits on a lock of another session. Or idle in a transaction for more than 15 minutes. |
The same marks on a group mean blocked sessions, or sessions idle in a transaction.
Refresh the data
Each tab shows the time of its data (Sampled). To refresh the open tab automatically, open the menu at the right of the tab bar. Select Every 5 s, Every 15 s or Every 60 s. The default is Off.
Open the session details
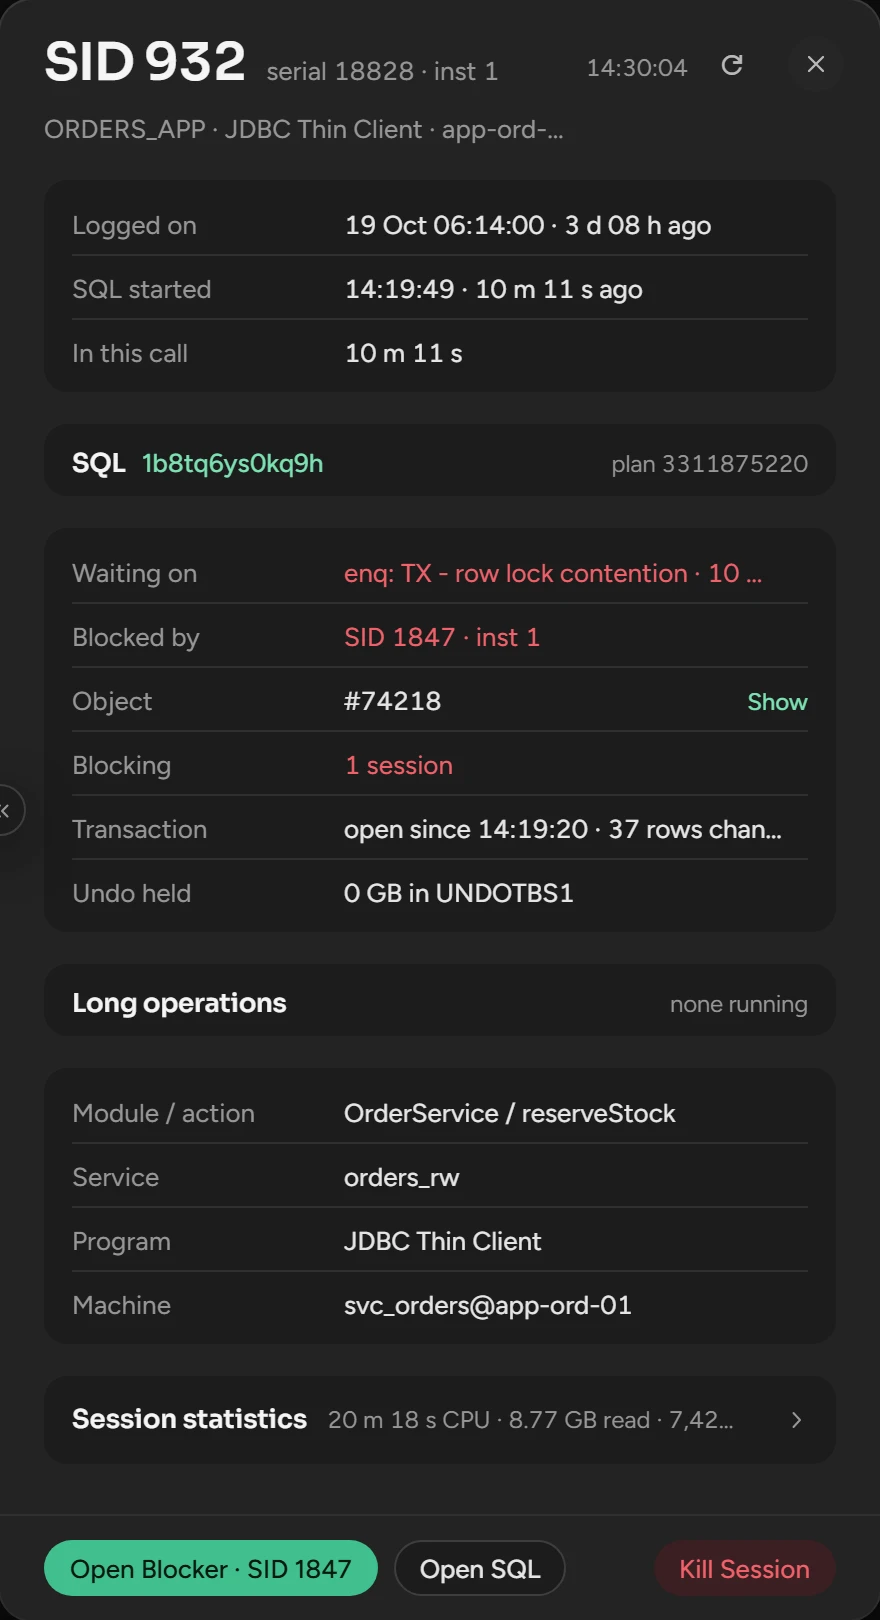
Click a Sid. The details show the SQL and plan, the wait and the blocker, the open transaction, the undo and temp, and the Session statistics.
- Show gives the name of the object that the session waits on.
- Open Blocker opens the session that holds the lock. Open SQL opens the SQL details.
Open a parallel query
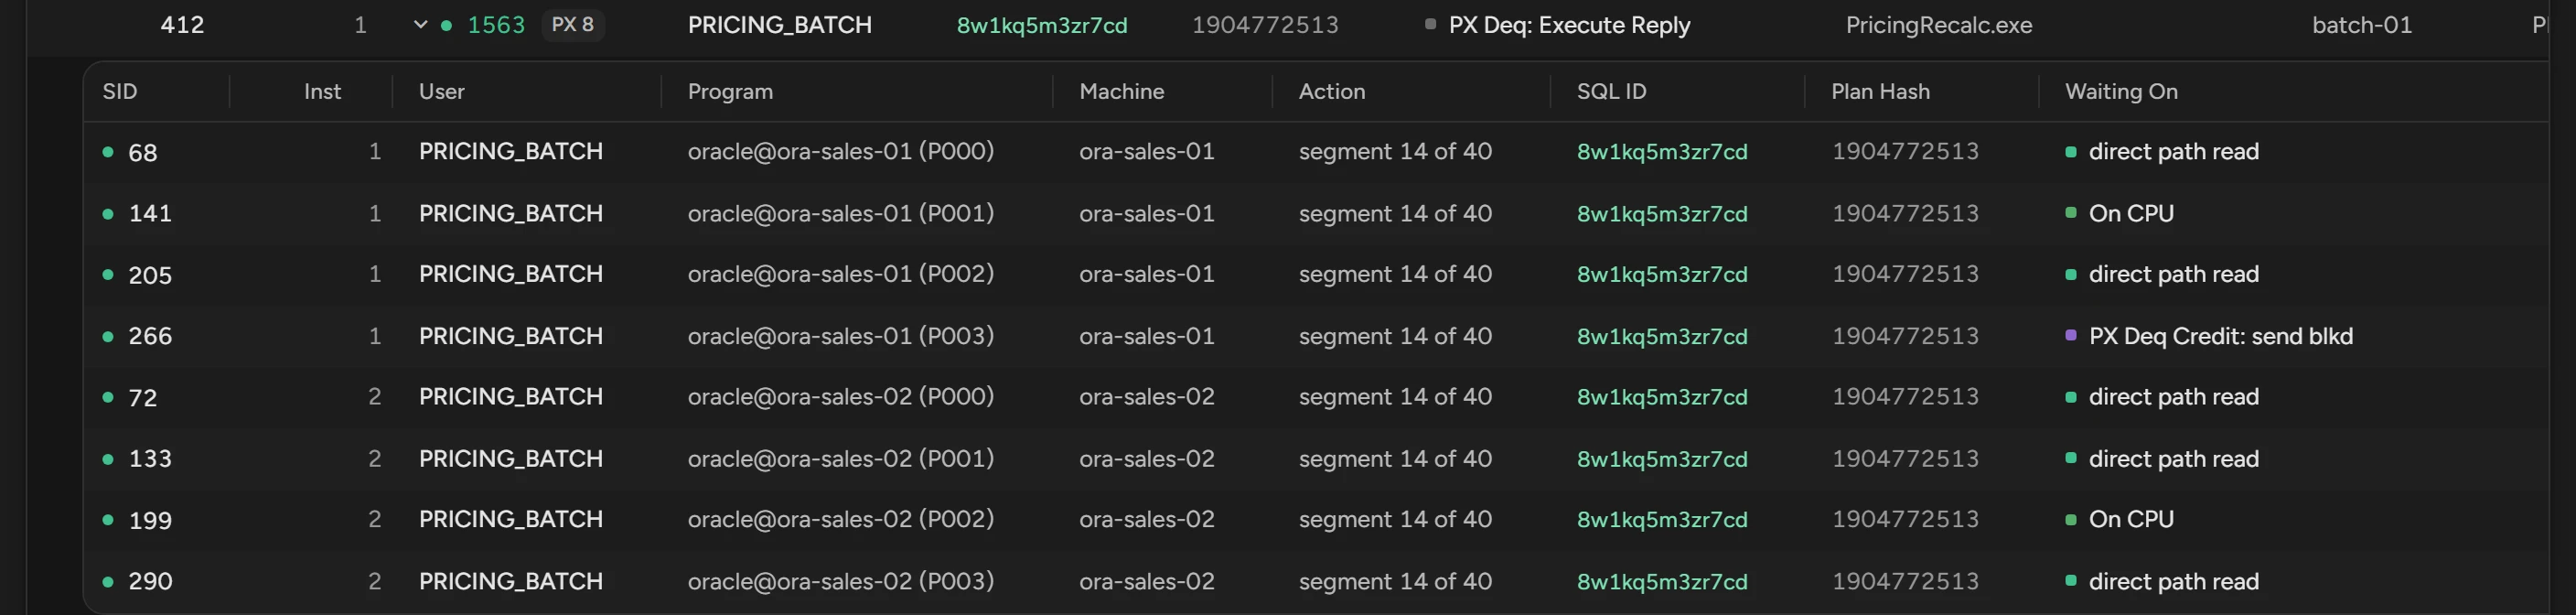
A parallel query counts as one session. Its coordinator shows PX and the number of servers. Click it to list the servers.
Look back with History
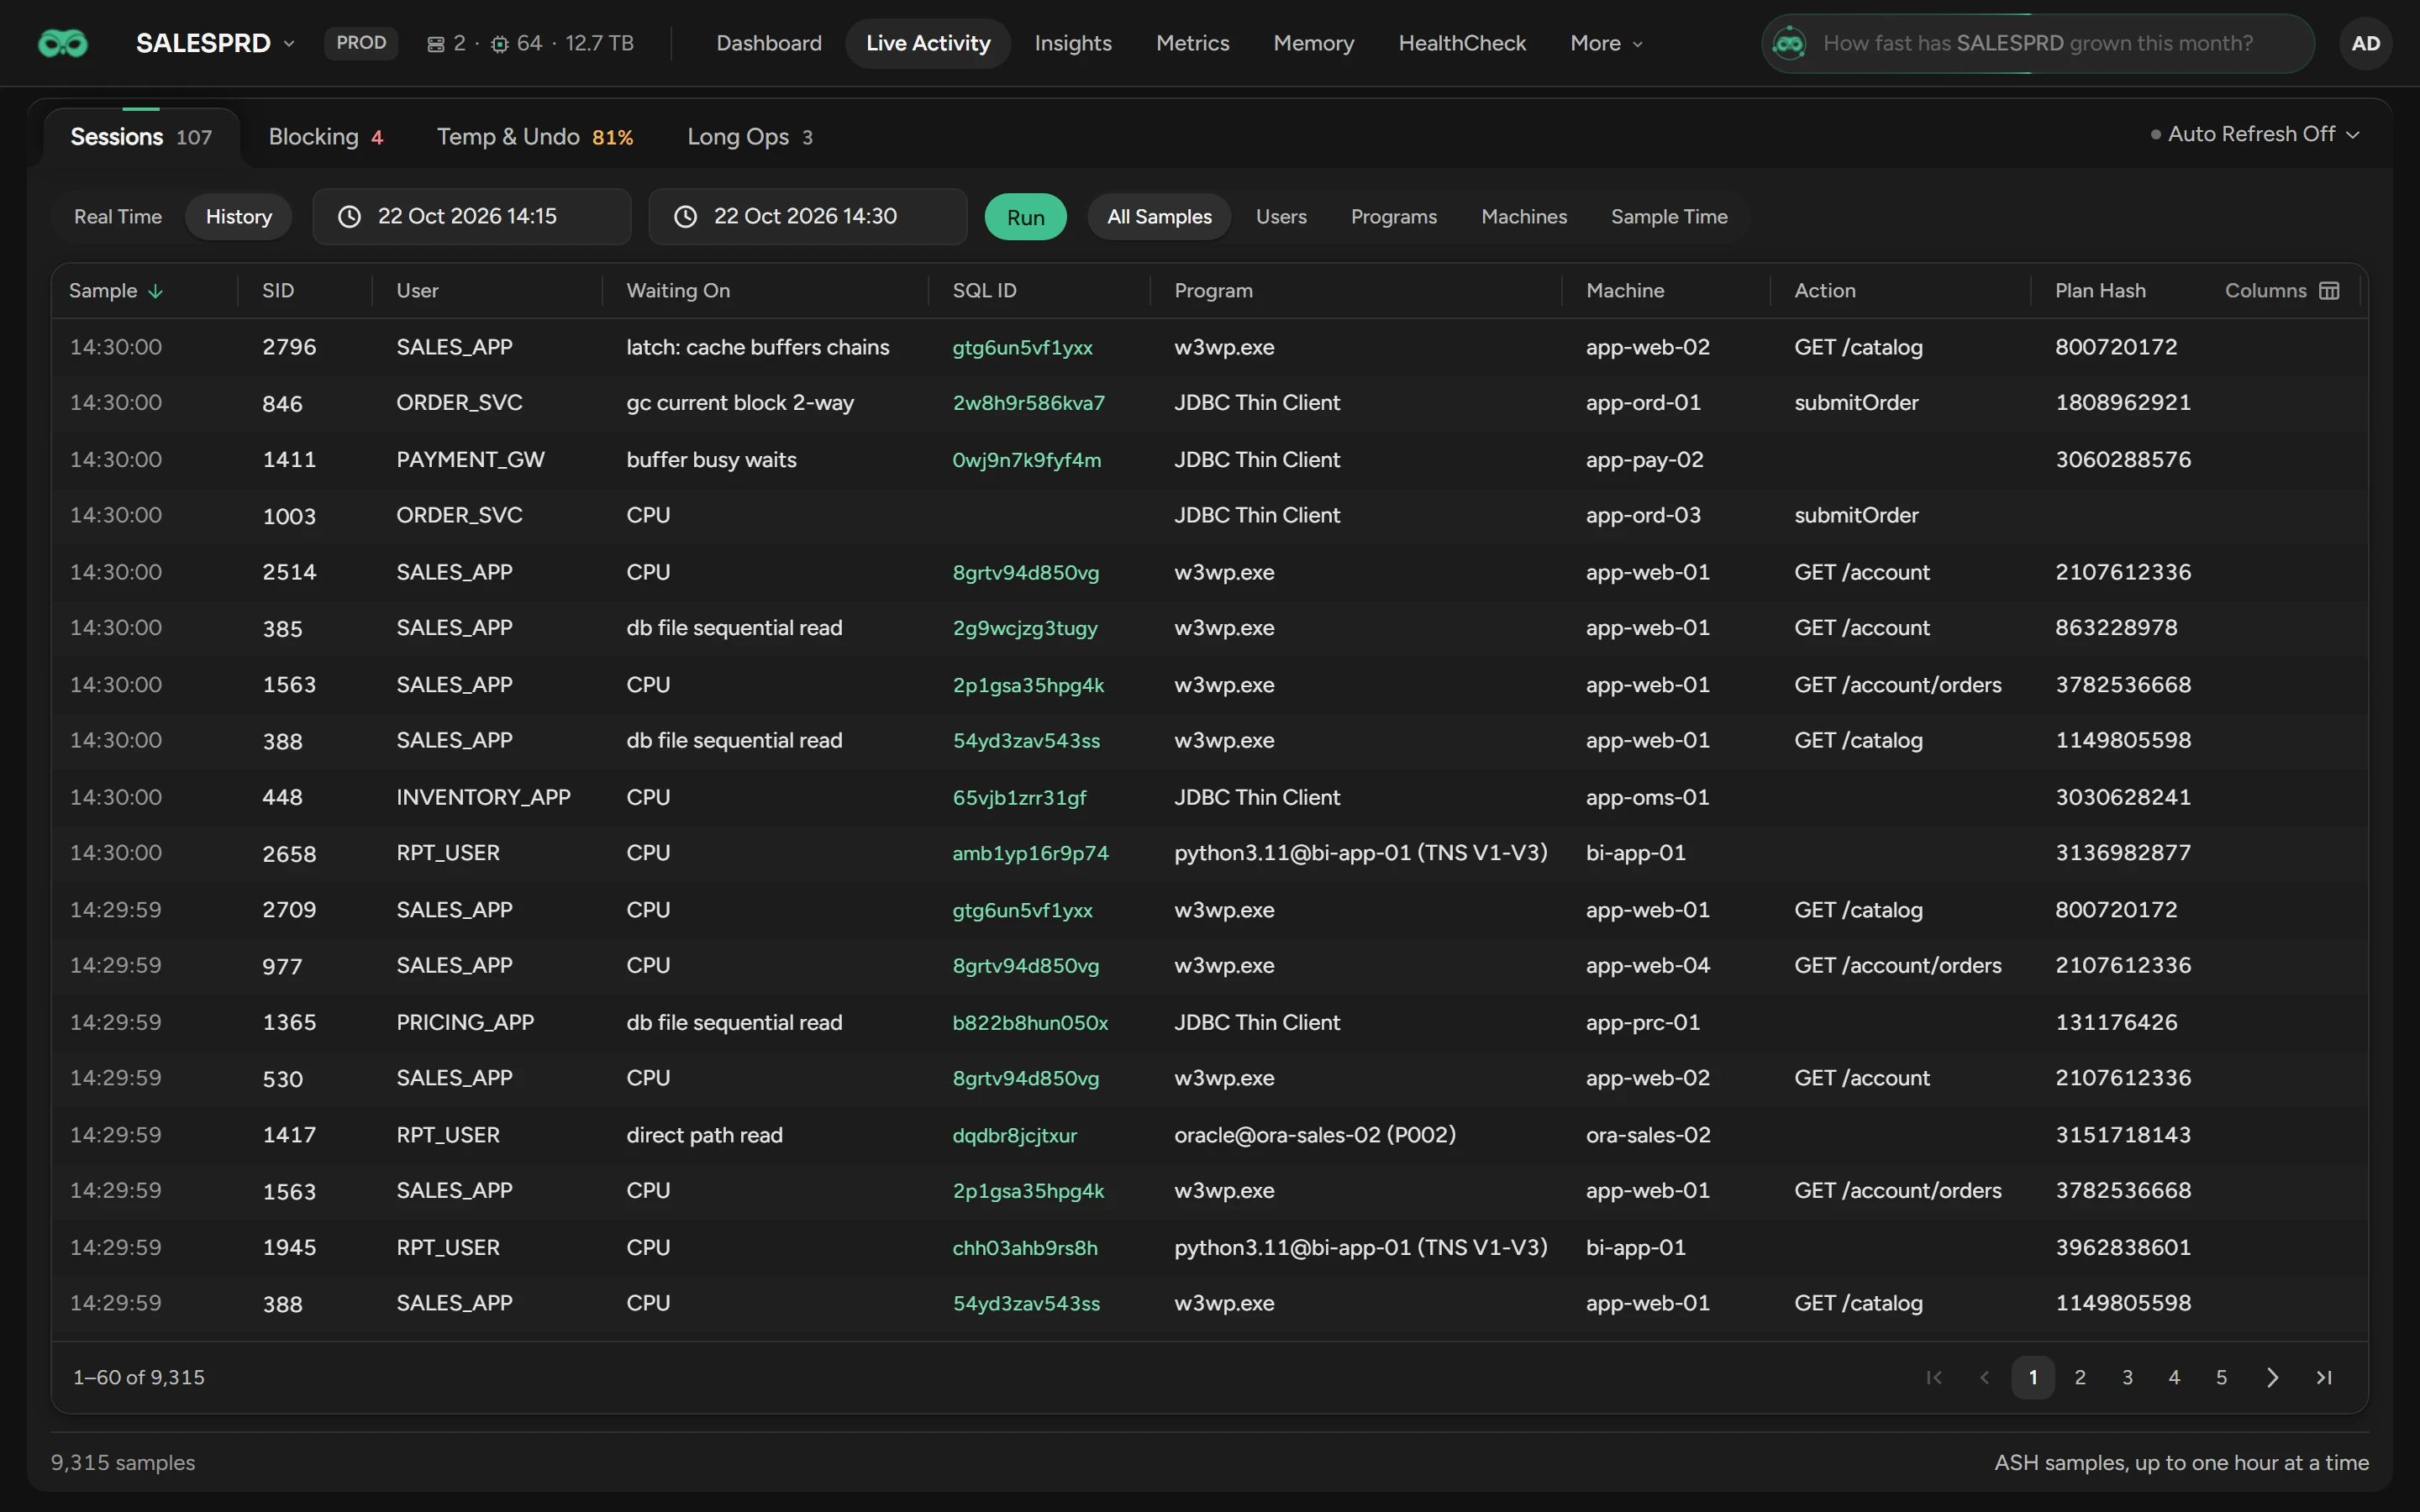
Click History.
Set the start and the end, one hour apart at most. The default is the last 15 minutes.
Click Run.
Each row is one session in one sample. To see who was busiest, group by SQL IDs, Users, Programs, Machines or Sample Time. To go back to now, click Real Time.
Blocking
The Blocking tab shows each lock wait as a chain. The root holds the lock, and the sessions under it wait.

| Column | What it shows |
|---|---|
| Waiting On | For the root: its wait, On CPU, or "Idle in a transaction, no call for" a time. |
| For | How long the session waits, or how long the root is in its state. |
| Behind It | The sessions that wait behind it, also further down the chain. |
| Object | The object id of the row. The session details give its name. |
To release the chain, right-click the root and select Kill Blocker. A waiter has no kill item, because its kill does not remove the cause.
Kill a session
A kill stops the call of the session and rolls back its open transaction.
Right-click the session and select Kill Session, or Kill Blocker on the root of a chain.
Examine the confirmation. For a root, it shows how many sessions it releases.
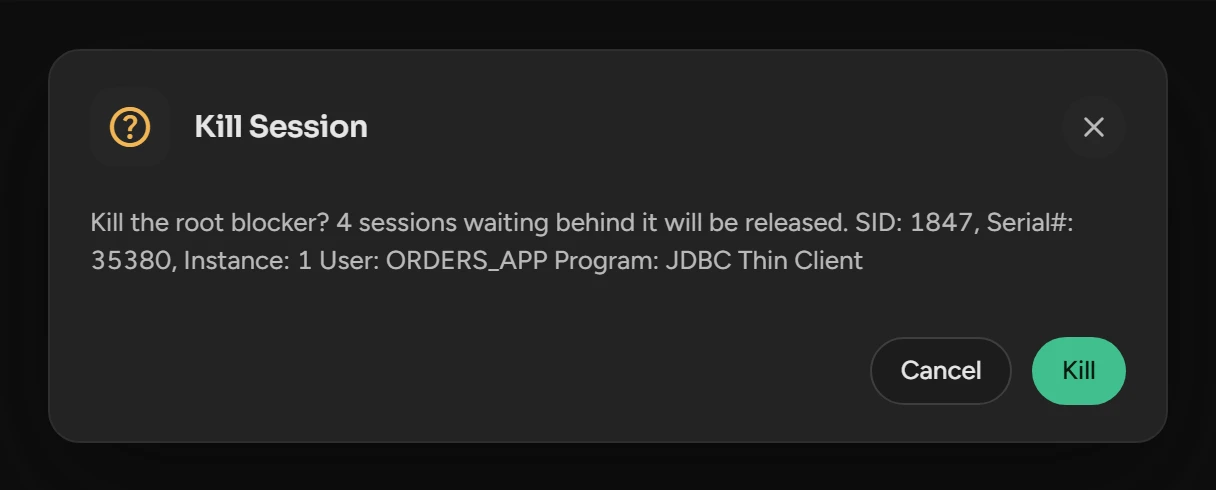
Click Kill.
Scops runs ALTER SYSTEM KILL SESSION 'sid,serial#,@inst_id' IMMEDIATE. Without the privilege, the kill fails with ORA-01031. The session shows under Killed while it rolls back.
Kill more than one session
In the flat list, right-click a row and select Select Sessions to Kill.
Select the sessions, then click the kill button in the footer, for example Kill 3.
Confirm.
Temp & Undo
The Temp & Undo tab shows who fills TEMP or holds undo. To show one tablespace, click it at the left.
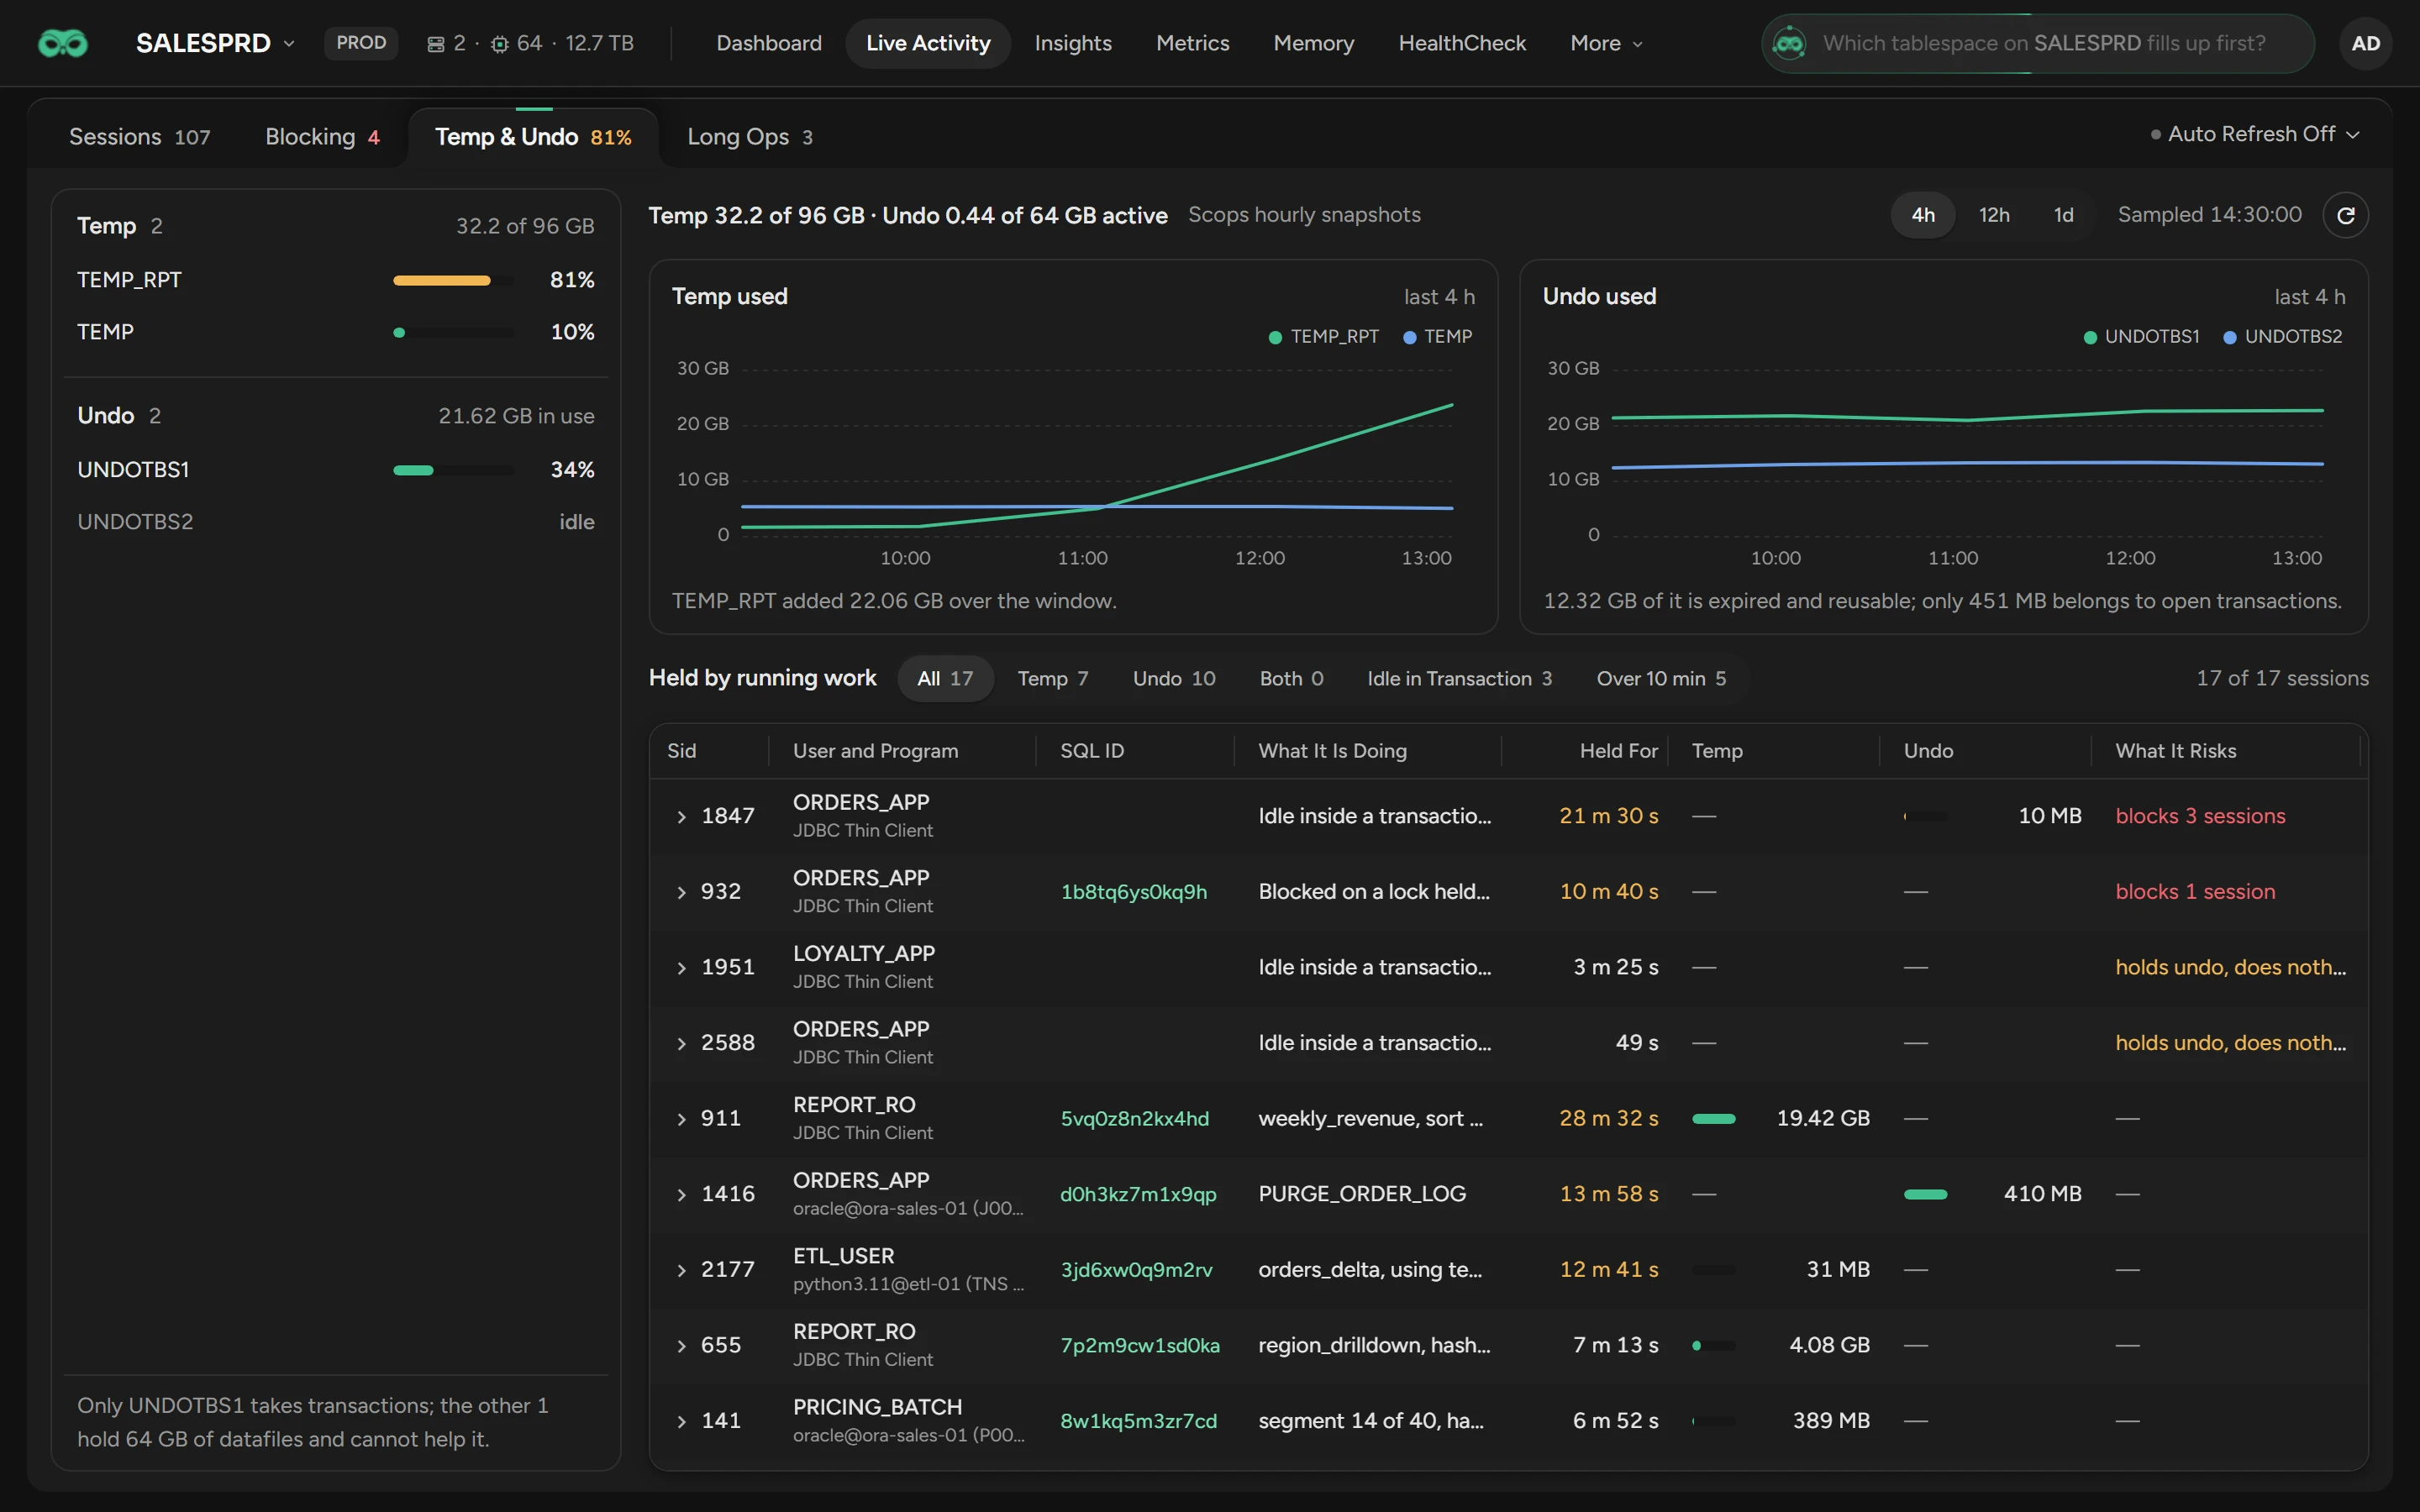
| Item | What it shows |
|---|---|
| The tab badge | The fullest temp tablespace or the active undo tablespace. Amber from 70%, red from 85%. |
| Temp used, Undo used | Charts over 4h, 12h or 1d. They can be later than the live numbers. |
| Held by running work | The sessions that hold temp or undo. Open a row for its segments and transaction, with Details and Kill. |
| Held For | Amber after 10 minutes, red after 30. |
| What It Risks | Only real effects, for example "blocks 3 sessions". |
Long Ops
The Long Ops tab lists the long operations that still run, the next to finish first. Oracle tracks only the operations that it expects to take more than six seconds. Click a row to open the session details.

Related
Updated November 3, 2026