Databases
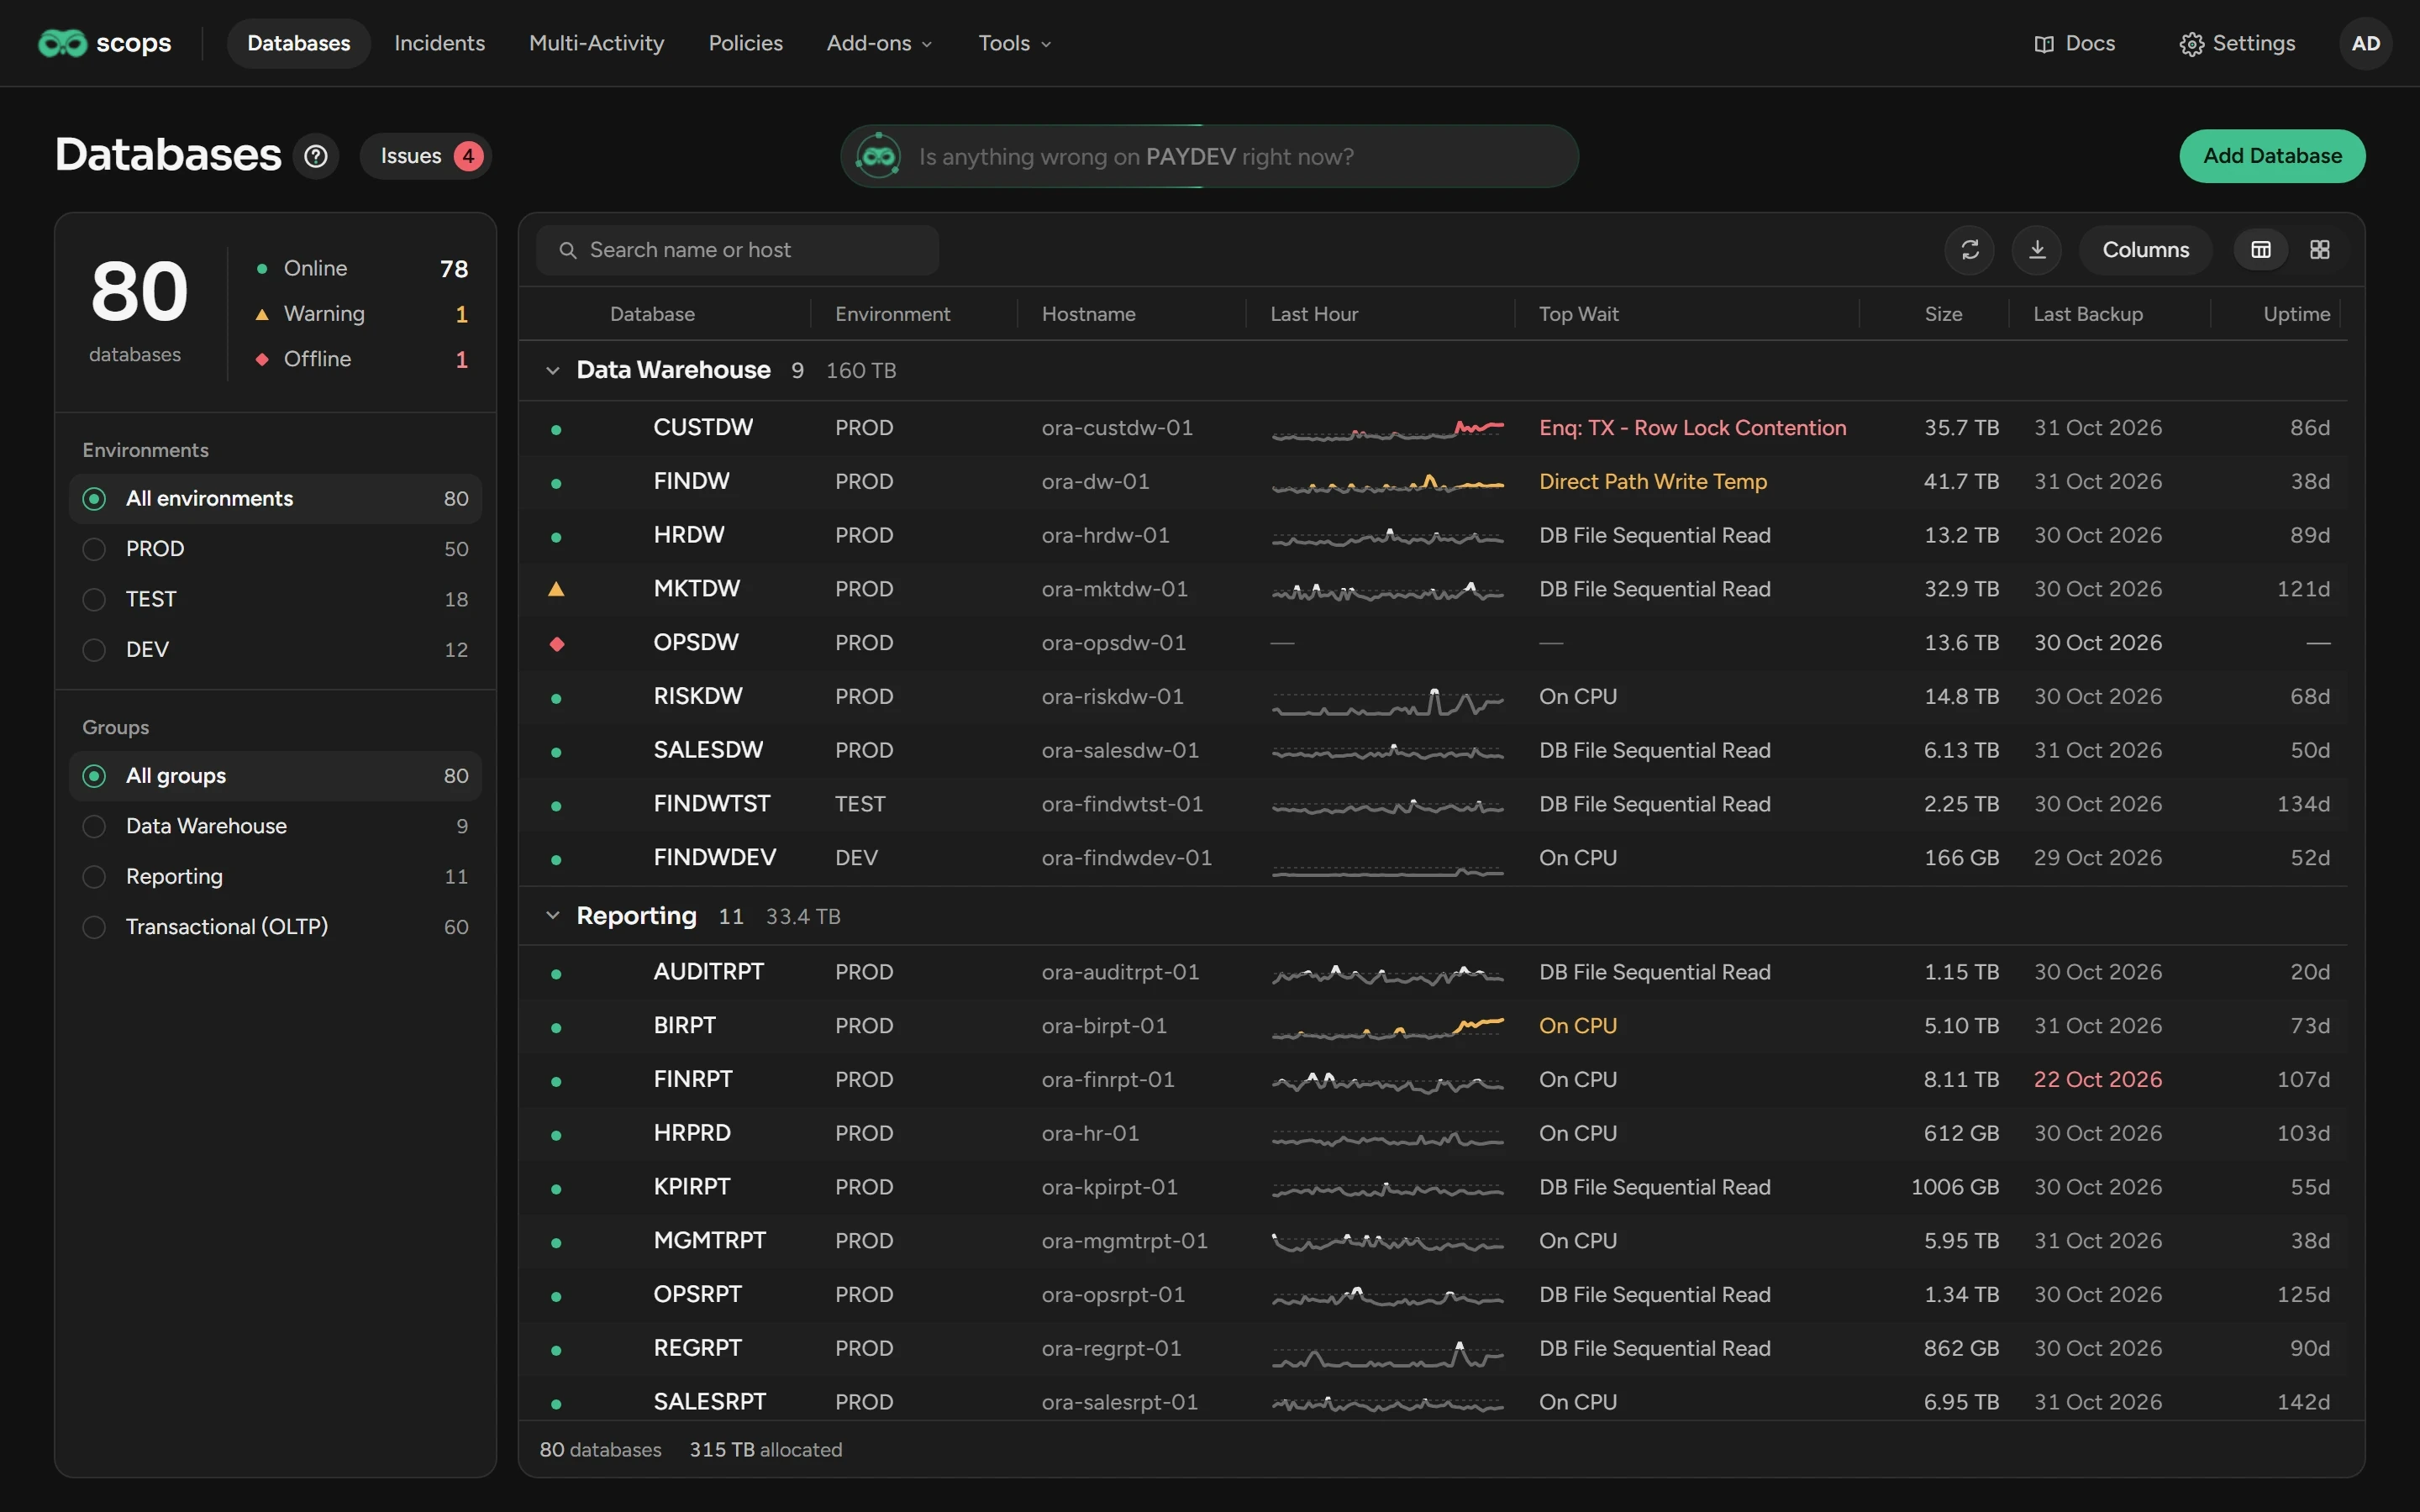
Find, open and manage the databases that Scops monitors, and see which ones have issues.
Before you begin
- All users who can sign in see the list.
- To add, edit or remove a database, you need Manage databases.
- Each item of the row menu needs the permission of its page, for example View Dashboard.
Find a database
- Type in Search name or host, or press / to go there.
- Select an environment in Environments or a group in Groups.
- Click Needs attention or Warning to show only those databases.
- To filter a column, point to its heading and click the funnel.
Open a database
- Click its name: its Dashboard opens in a new tab.
- Click its row: its panel opens.
- Right-click its row: the row menu opens.
The database panel
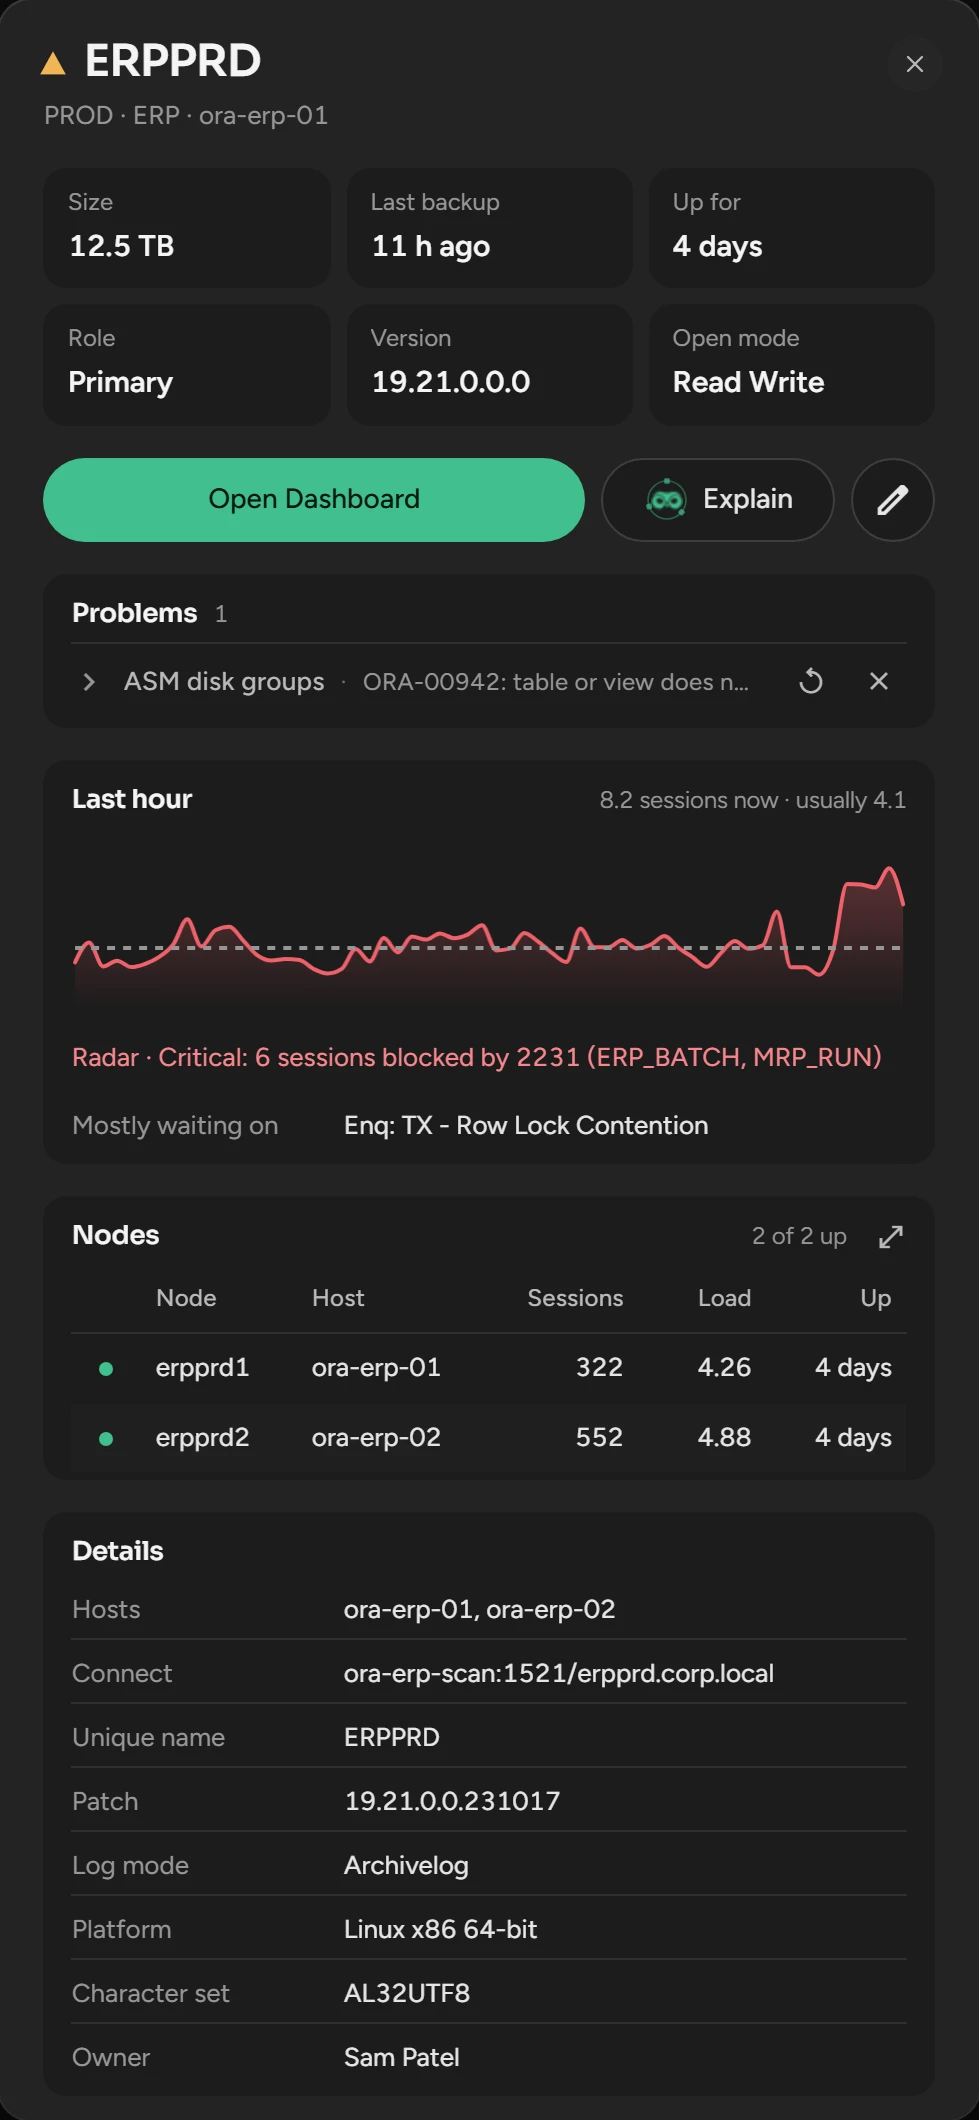
| Part | What it shows |
|---|---|
| The tiles | Size, last backup, uptime, role, version and open mode. |
| Open Dashboard, Explain, the pencil | The Dashboard, a health report from Scops AI, and Edit Database. |
| Problems | Work on the database that fails or is late. The run button runs it again. The cross clears the line until the next failure. |
| Last hour | The activity against the usual load. |
| Nodes | Each instance, read live. |
| Details | The hosts, the address, the patch level, the platform, the character set and the Owner. |
An error such as ORA-00942 in Problems often means a missing grant: see Fix a missing grant.
The row menu
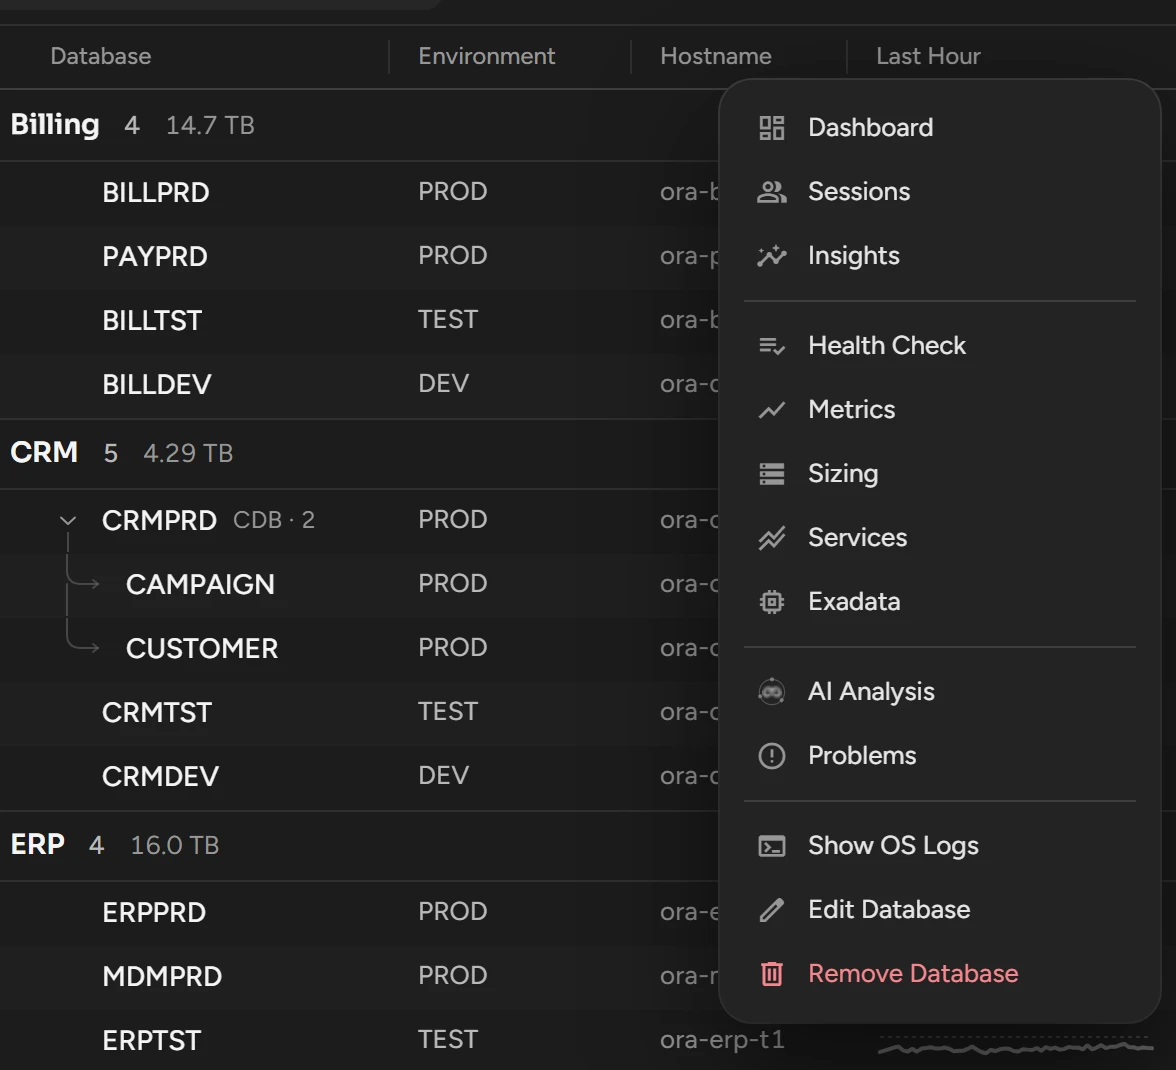
| Item | What it does |
|---|---|
| Dashboard, Sessions, Insights, Health Check, Metrics, Sizing, Services, Exadata | Opens that page in a new tab. Sessions opens Live Activity. Exadata shows only for an Exadata database. |
| AI Analysis | The same as Explain. |
| Problems | Opens the panel. |
| Show OS Logs | Shows what Scops found in the alert, ASM, CRS and listener logs. |
| Edit Database, Remove Database | See below. |
See the issues
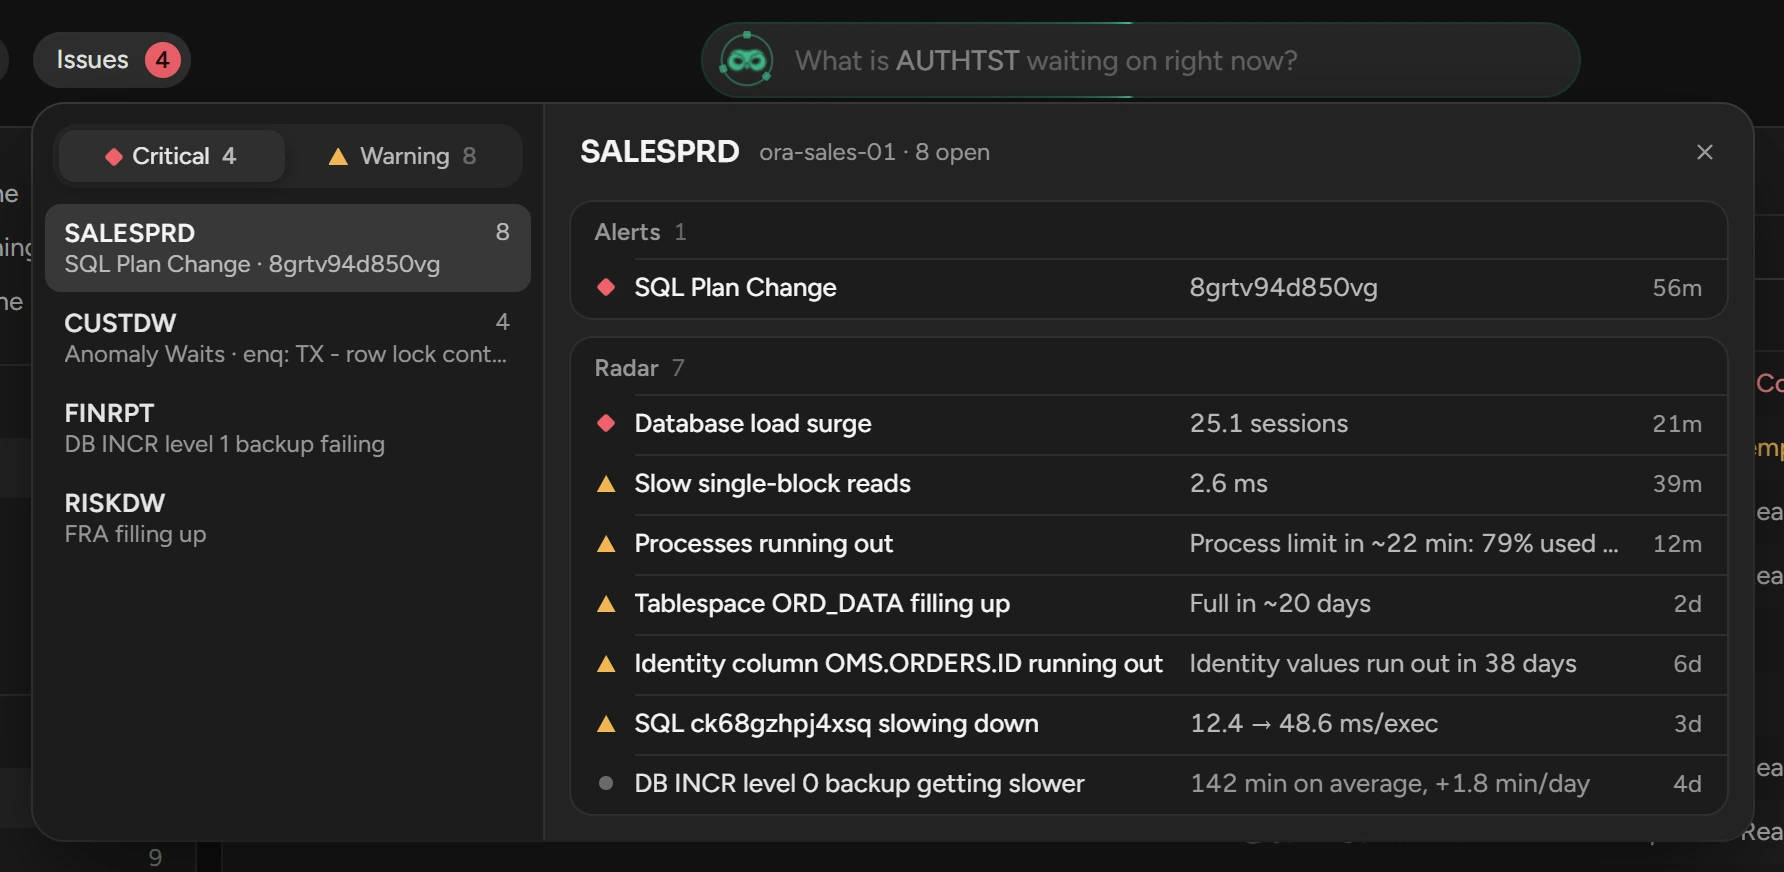
Click Issues beside the title. The number shows how many databases have something open.
Select the Critical or the Warning tab. The databases with an open alert are at the top, under Alerts. The other databases are under Radar.
Select a database. The list shows what is open: Alerts, Radar and Status.
Click a row to open its source. A No data row opens the Dashboard.
The list needs View alerts on Databases. 0 means that nothing is open, and the button does not open. Only some issues change the status of a database.
Add a database
Click Add Database at the top right. See Add a database.
Edit a database
Right-click the row and select Edit Database. See Edit a database later.
Remove a database
Right-click the row and select Remove Database.
Click Yes.
Scops stops the monitoring and frees the place in your edition.
Scops also deletes the collected data of the database from the repository.
Choose the columns
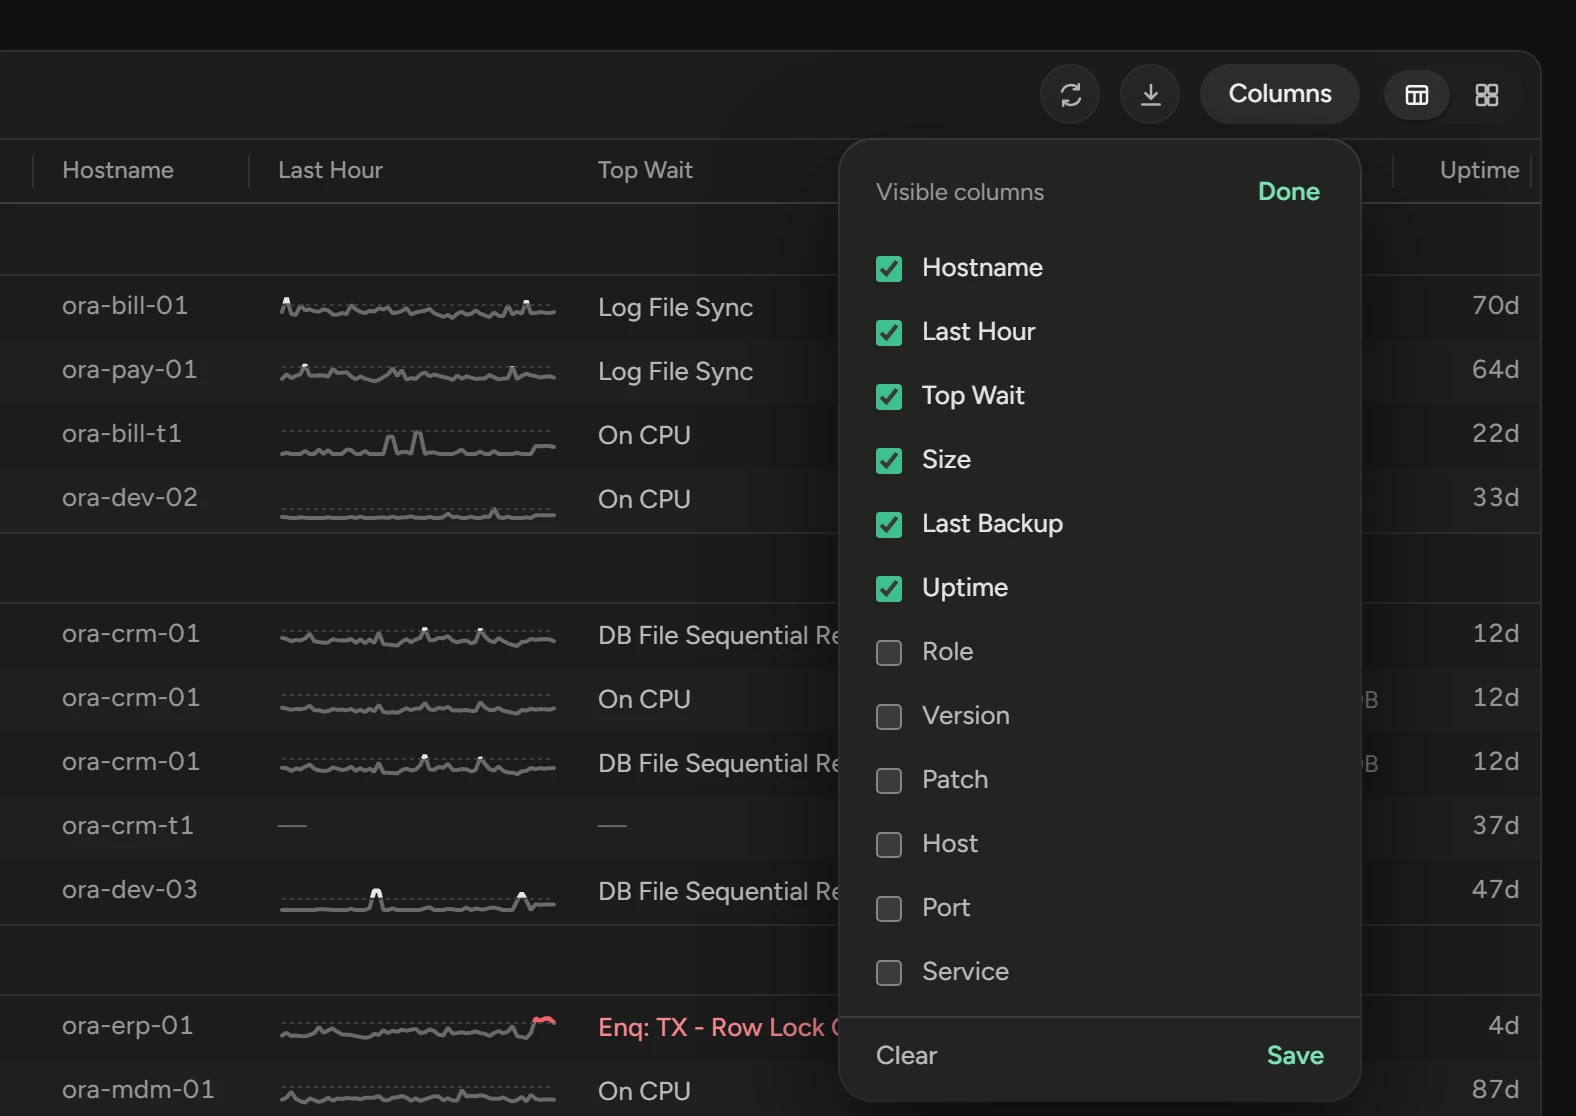
Click Columns in the toolbar.
Tick up to 12 columns.
Click Save to keep them in this browser, or Done for this visit only.
Show the databases as cards
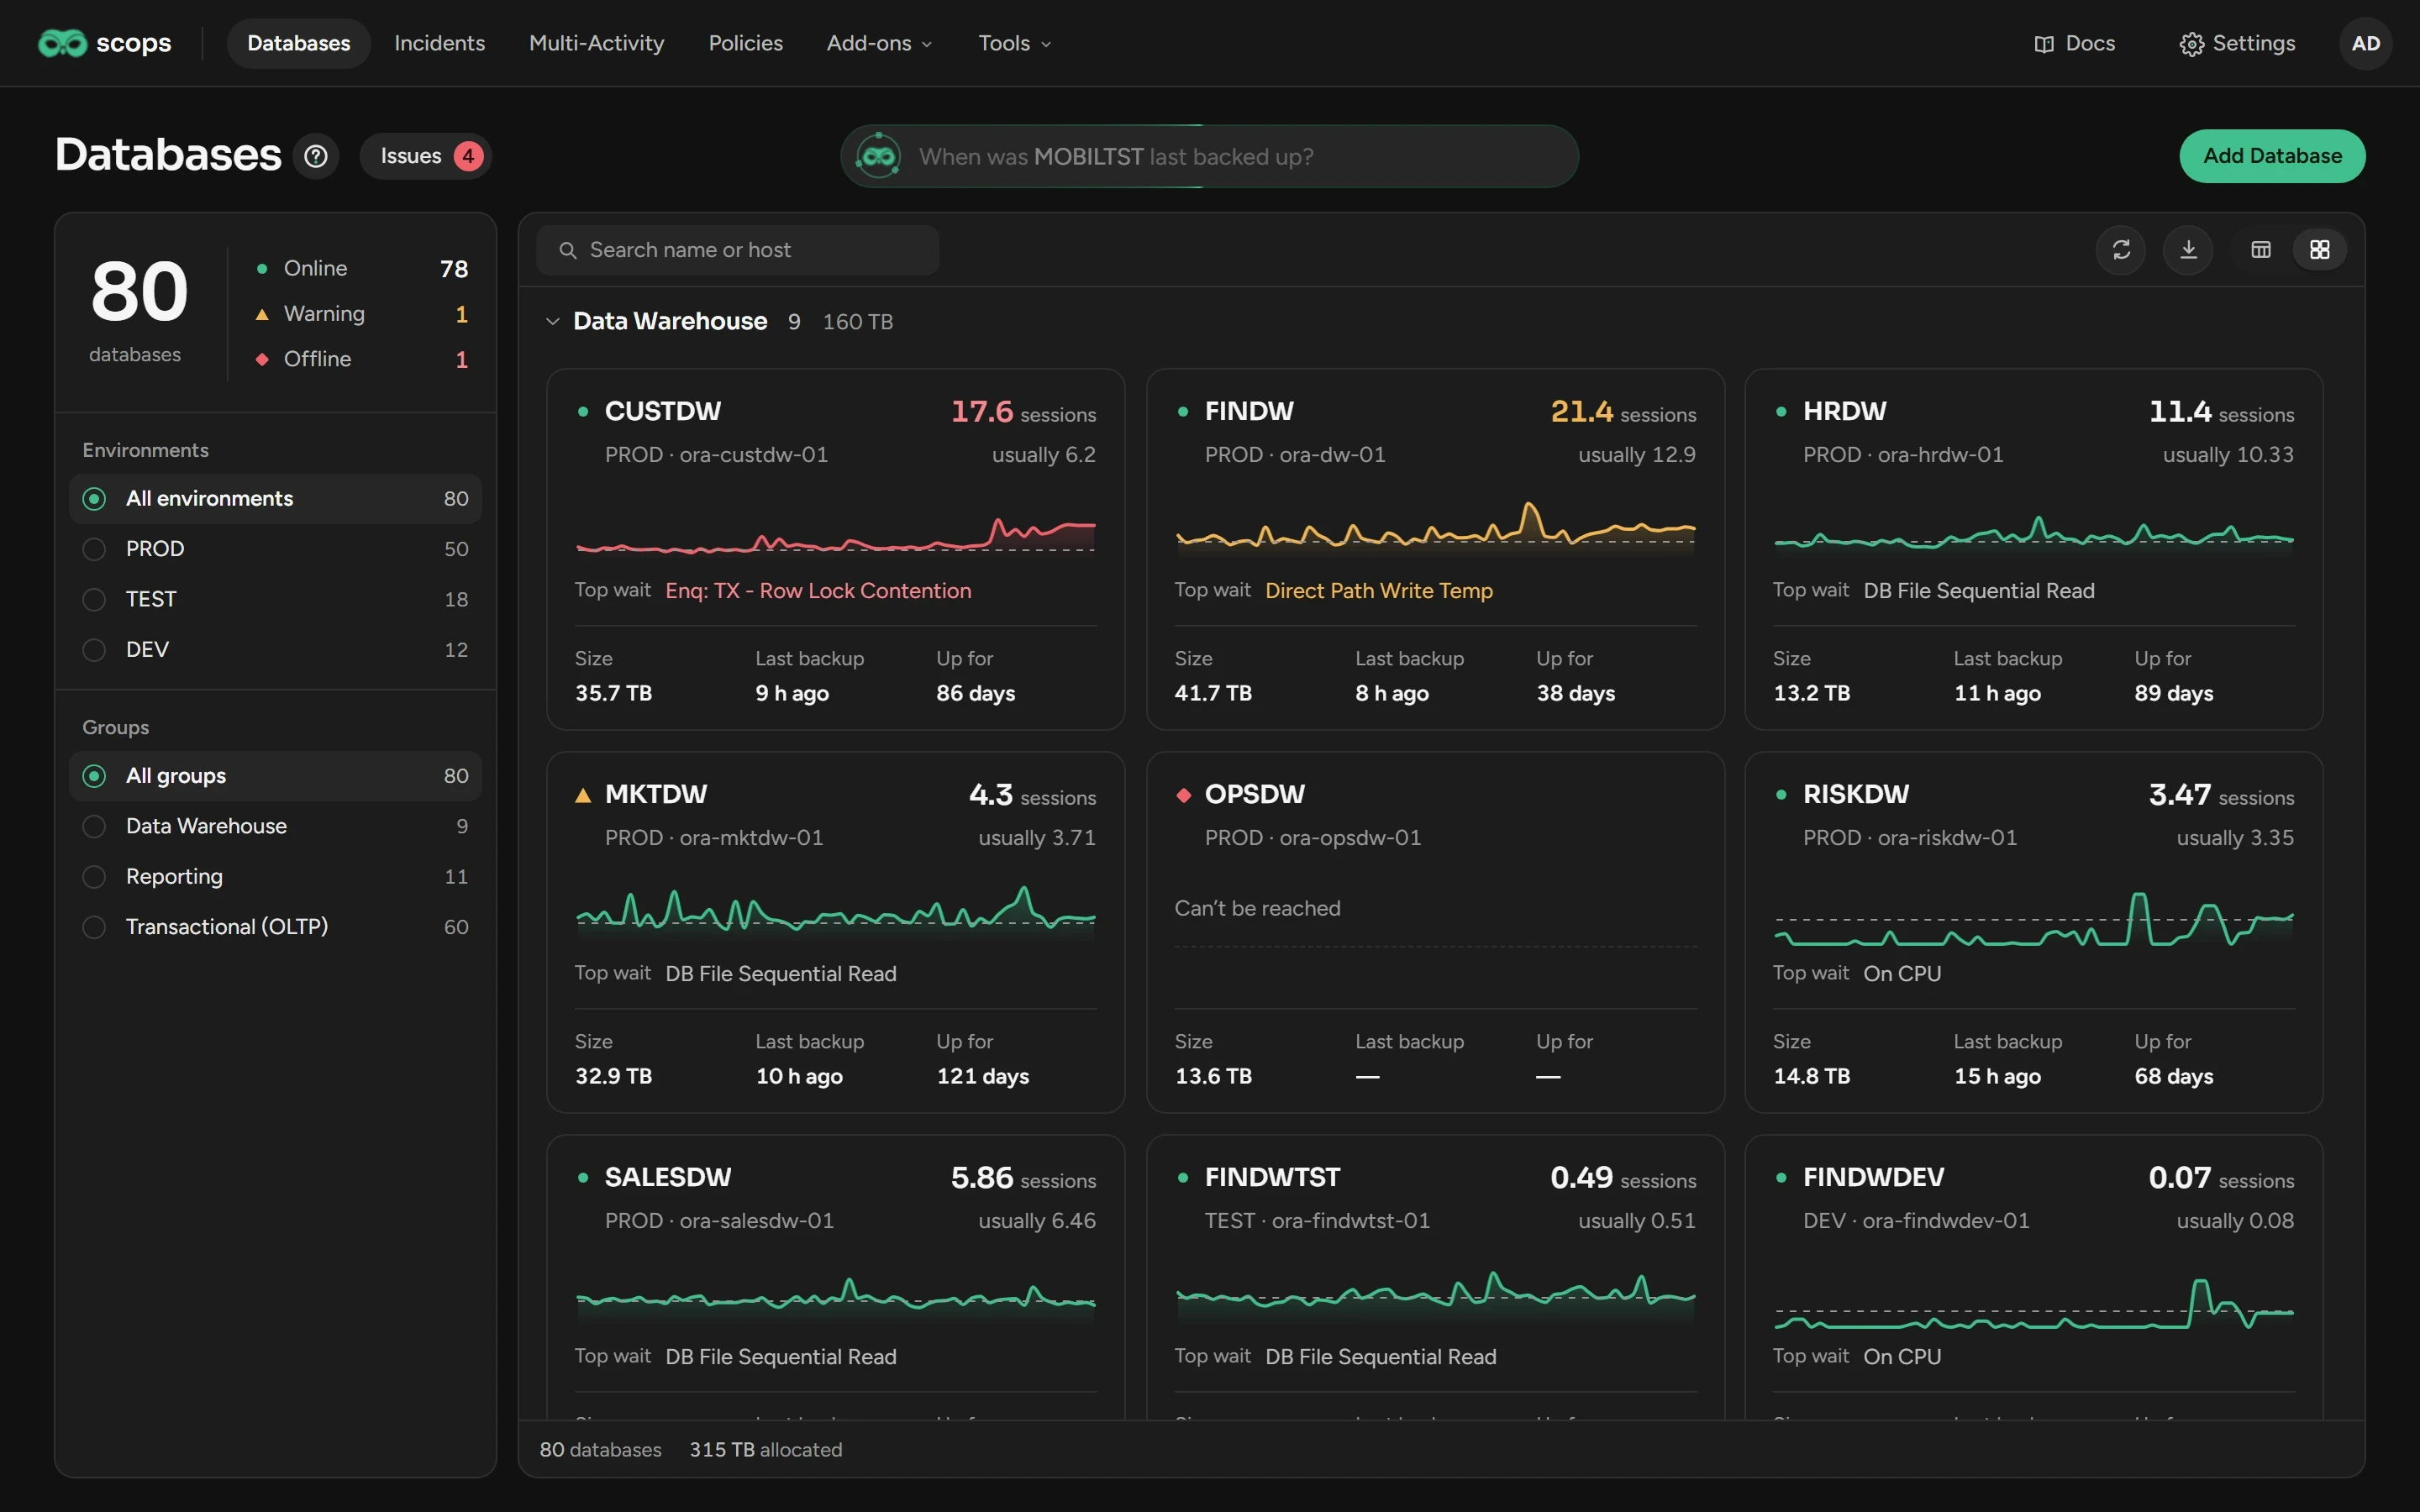
Click the cards button at the right end of the toolbar. With 20 databases or fewer, the page opens as cards.
Export the list
Click the download button in the toolbar. Scops writes the databases that the filters show to an Excel file.
Ask Scops
Type a question about your databases in the Ask Scops field and press Enter. The field shows when Scops AI is on, and needs View Insights. See Ask Scops AI.
What you see
The list has one section for each group, or for each environment when you select a group. A database that needs attention moves to the Needs attention section on top. The page refreshes every 10 seconds.
Status
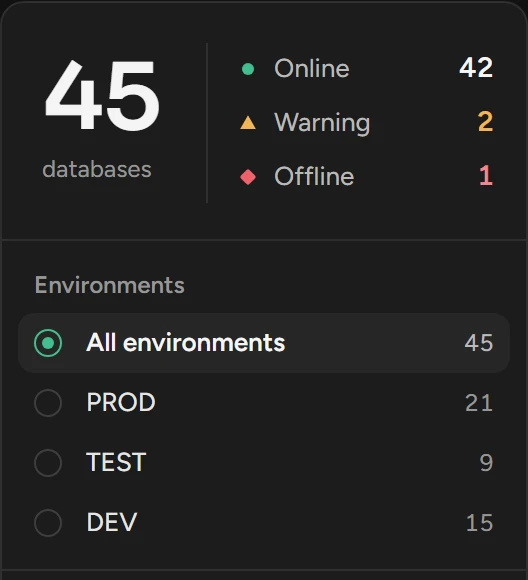
| Status | Mark | What it means |
|---|---|---|
| Needs attention | Red diamond | A problem to look at now. See below. The database moves to the Needs attention section, and Now shows the problem in red. |
| Warning | Amber triangle | A problem to look at soon. See below. The database stays in its section, and Now shows the problem in amber. |
| Online | Green dot | None of these problems. |
| Not Monitored | Empty ring | Outside the limit of your edition. See below. |
The status shows only problems of now or of the last 30 minutes, and goes back when the problem stops. When a database has more than one problem, Now shows the first in the tables below. Point to a mark to see the problem, or click it to open the panel.
Alerts, the other Radar findings, late backups and failed work do not change the status. Issues and Incidents show them.
Needs attention
The Needs attention section shows the databases in the order of this table. For the same problem, the newest shows first.
| Problem | When it counts |
|---|---|
| Scops cannot connect | Scops tries again every 5 minutes, and the panel shows why. |
| The database refuses new sessions | ORA-01035, ORA-00020, ORA-00018, ORA-12516, ORA-12518, ORA-12519 or ORA-12520 on two connection checks in a row. |
| Work stops | Radar finds Executions stalled at Critical: sessions stall on a lock, a latch, a hot block, a log switch or the resource manager, or behind one blocker. |
| The archiver is stuck | Radar finds Redo log switches wait for archiving at Critical, or ORA-00257 on two connection checks in a row. ORA-00257, ORA-16038, ORA-19809 or ORA-16014 in the OS logs also count. |
| Processes or sessions are at the limit | 97% of the limit, or 5 or fewer left, on two readings in a row. |
| Sessions wait on a lock | Radar finds Sessions blocked at Critical. |
| A wait class surges | Radar finds a wave at Critical: a lock wave on three readings in a row, with half of its sessions measured blocked, or a wave whose work stopped (Executions stalled at Critical in the same incident). With Ignore daily patterns on, a wave at the same time each day does not count. |
| A RAC instance is down | The database answers, but one of its instances is down. |
| A serious error in the OS logs | For example a corrupt block, a lost file, a stopped background process or an evicted node. |
Warning
| Problem | When it counts |
|---|---|
| A Needs attention problem is held back | A user acknowledged or snoozed its Radar finding, or the environment has Needs attention off. |
| Redo does not reach a standby | On two Data Guard readings in a row. |
| Reads or commits are slow | Radar finds Slow single-block reads or Slow commits at Critical. |
| Memory is at its limit | Radar finds PGA near its limit or Shared pool draining at Critical: the PGA at 95% of its limit, or 3% or less of the shared pool free. |
| An internal or space error in the OS logs | For example ORA-00600, ORA-07445 or ORA-04031, a segment that cannot extend, or UNDO that is full. |
| An instance restarted | In the last 30 minutes. |
A Radar finding counts only while its latest reading, of the last 10 minutes, is at Critical. When the reading falls, the status changes at once, also when Radar keeps the finding at Critical for one more cycle. See the Detector reference for each finding.
An error in the OS logs counts for 30 minutes. Scops reads the OS logs only with the OS credential of the database.
Columns
Database and Environment always show. These columns show by default:
| Column | What it shows |
|---|---|
| Hostname | The server, as the database reports it. |
| Last Hour | The active sessions of the last hour. See below. |
| Now | For a red or amber status, the problem, how long it has lasted, and who acknowledged or snoozed it. For the others, the top wait of the last 5 minutes, for example On CPU. |
| Size | The space allocated to the datafiles. |
| Last Backup | The date of the newest backup with datafiles. · Standby marks a backup on a standby. |
| Uptime | The days since the instance started. |
A dash means no value yet. A container database has a CDB tag, and its pluggable databases show under it.
The Last Hour line
One point for each minute, against the usual load of this database at this hour. Only the part above the dashed upper limit is strong.
The line turns amber when the last 5 minutes are much above the usual load, or when Radar Engine reports a wait or load problem. It turns red only when the database needs attention. Point to the line to see the cause.
Databases outside your edition
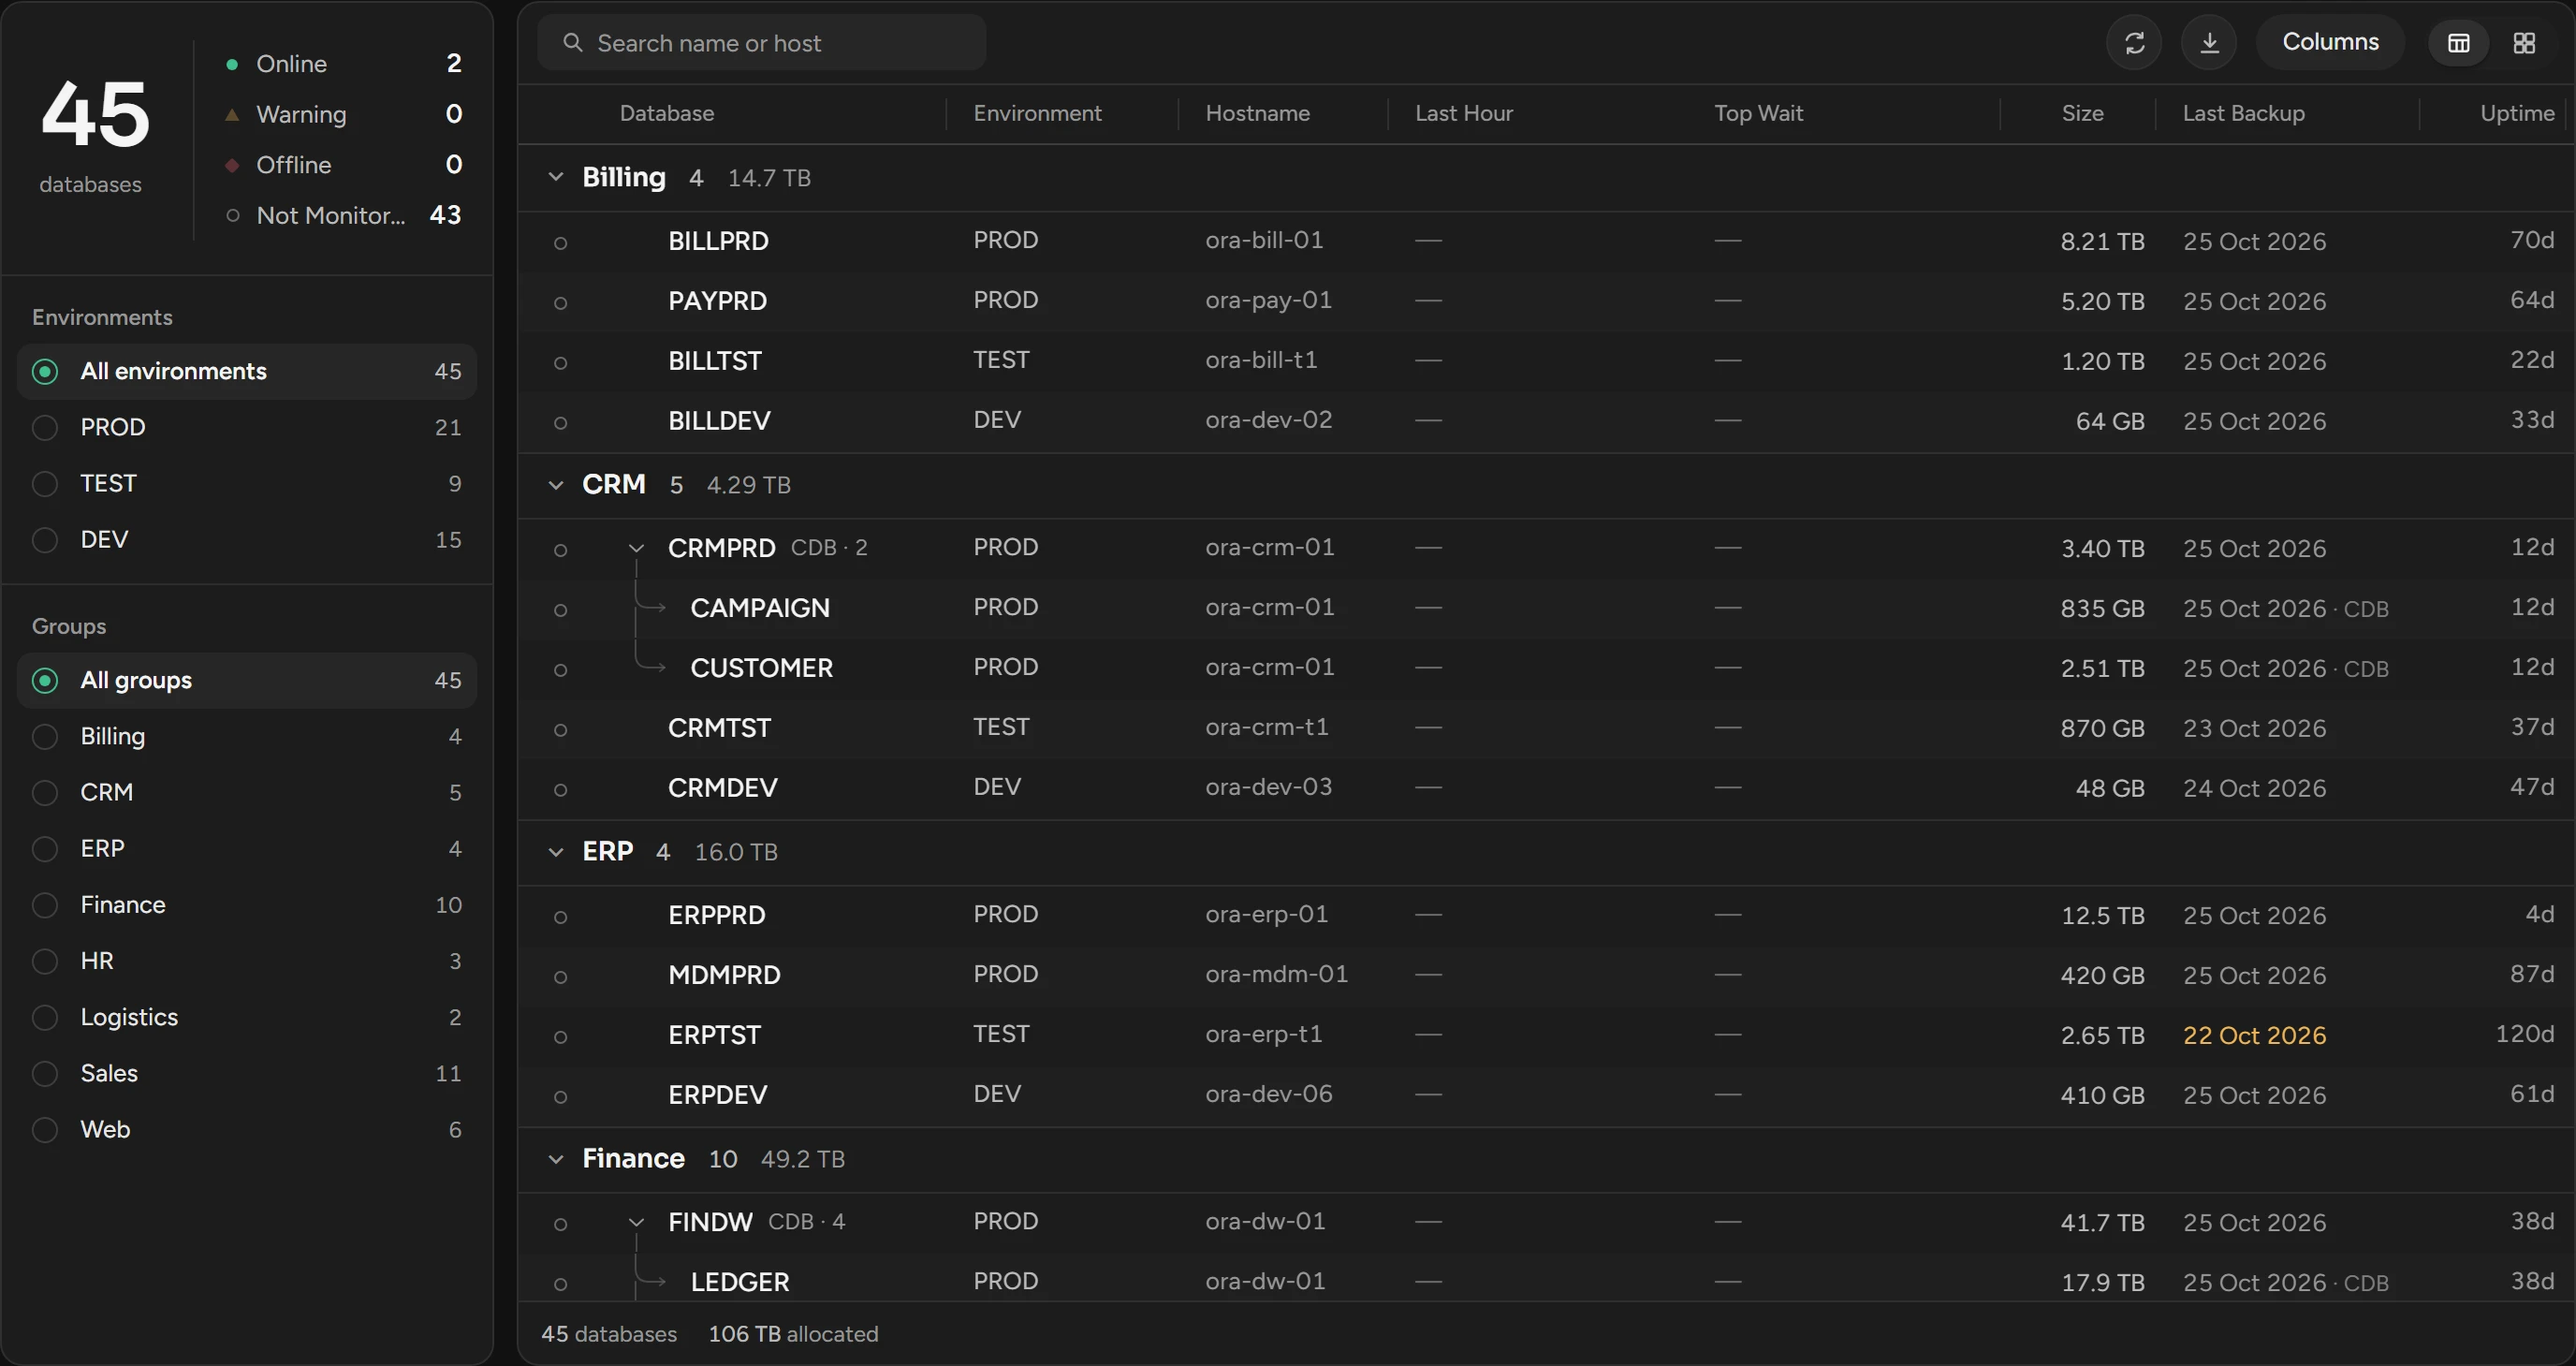
When you have more databases than your edition allows, Scops monitors the ones that you registered first. The others are Not Monitored: they show their last values, and their pages show only a line about the edition. See Databases beyond the limit.
Related
Updated November 10, 2026