Health Check
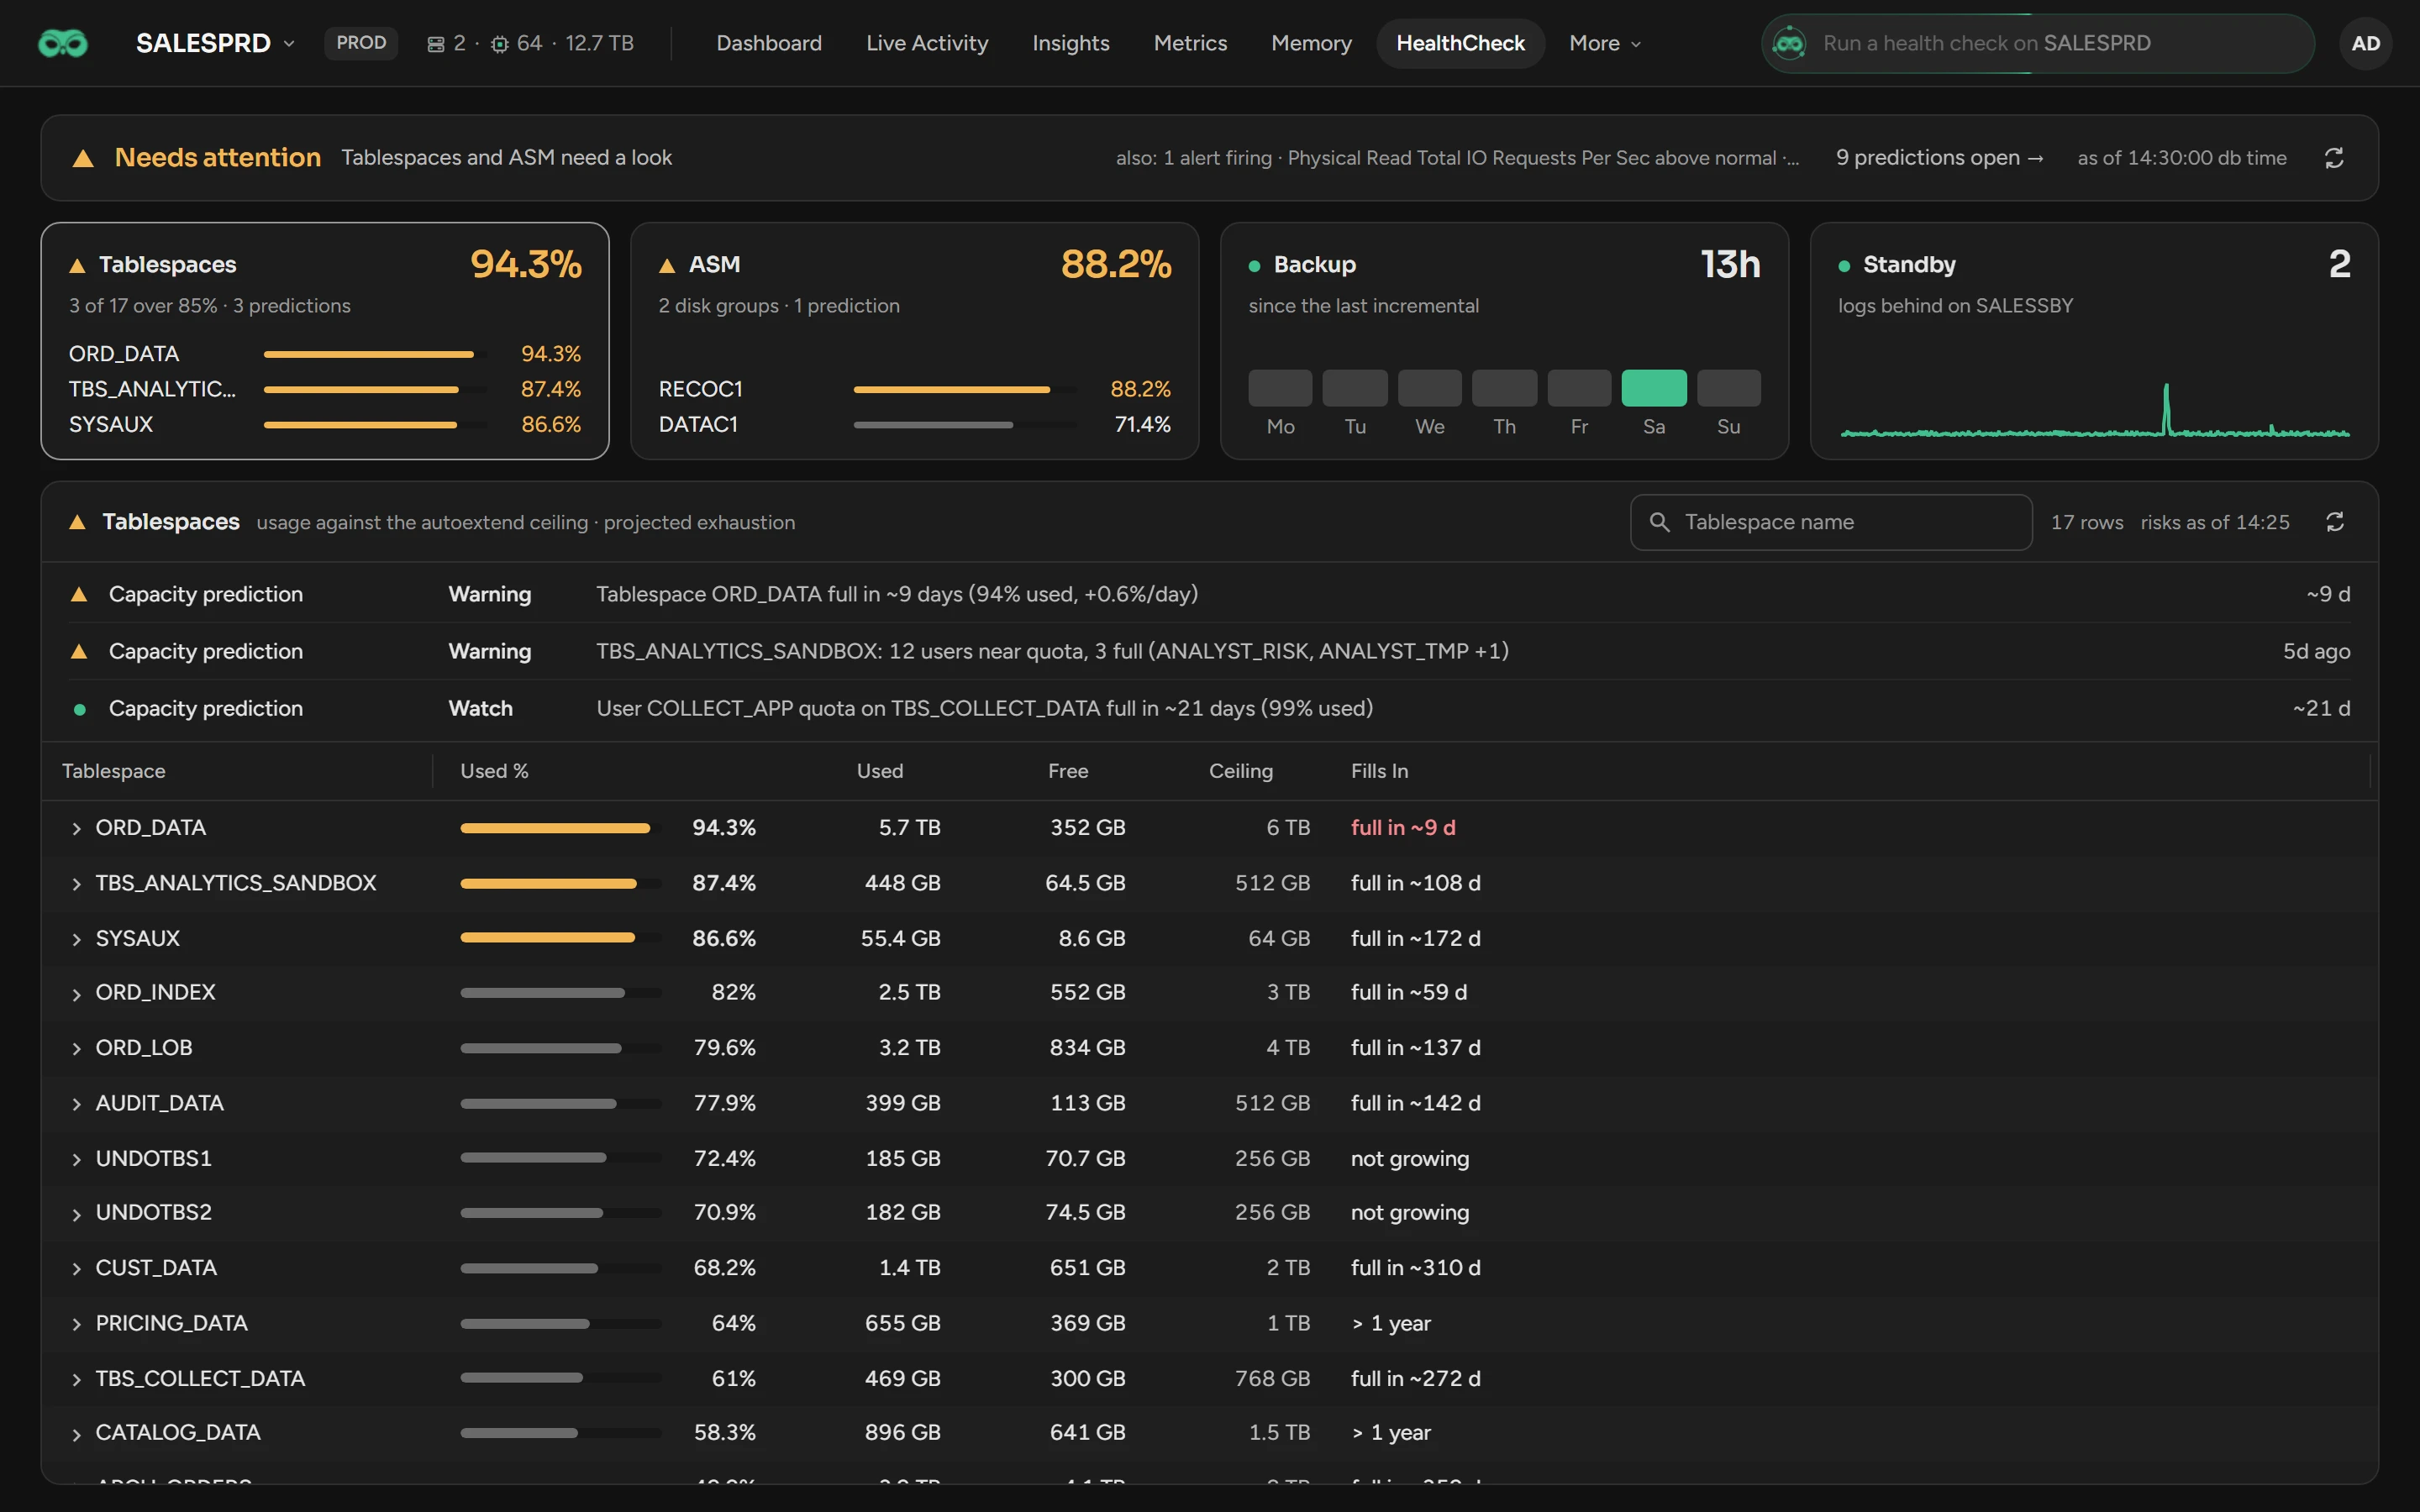
Use Health Check to see if one database is in good condition: its tablespaces, ASM disk groups, backups and standby.
Before you begin
- You need the View HealthCheck permission. Open the page with HealthCheck in the database bar.
- With the Cache switch of the database on (see Monitoring), Scops reads the four areas every 10 minutes. The page then opens at once, and the standby has a gap history.
Read the verdict
| Verdict | Meaning |
|---|---|
| Healthy | All areas are within limits, and Radar Engine predicts no problem. |
| Needs attention | At least one area is amber. |
| At risk | At least one area is red. |
| Partly unchecked | Scops could not read an area. |
also: lists risks outside the four areas, such as an alert that fires. The count of predictions opens the Radar tab.
Find the area that needs attention
The page opens on the worst area. Click a card to open another area. A card is also amber or red when Radar predicts a problem in its area.
| Card | Figure | Amber | Red |
|---|---|---|---|
| Tablespaces | The fullest tablespace, against its autoextend max size | From 85% | From 95% |
| ASM | The fullest disk group | From 75% | From 90% |
| Backup | The time since the last full or incremental backup | Older than 24 hours, or a failed full or incremental run in the history | Older than 2 days, or such a failed run in the last 24 hours |
| Standby | The widest gap in archived logs | From 20 logs, or a transport that is not valid | From 50 logs, or a destination with an error |
The strip of the Backup card shows seven days:
- the accent color: a full backup;
- gray with a line in the accent color: an incremental backup;
- light gray with a line in the accent color: archive logs only;
- an outline: a failed run;
- an empty outline: no backup.
Check the tablespaces
Max Size is the size that autoextend can reach. Fills In shows when the tablespace is full, from the Radar forecast or the growth of the last 8 days. Its bar shows the days left on a one-year scale: a short bar is a tablespace that fills soon. It is red within 14 days, amber within 45.
Open a row to see its growth, its settings and its datafiles. A mark shows a datafile with autoextend off: a hard limit.
Check the ASM disk groups
Each disk group shows Used %, Usable space after redundancy, raw Free and Total, Redundancy and State. Open a row to see its growth and its disks.
Check the backups
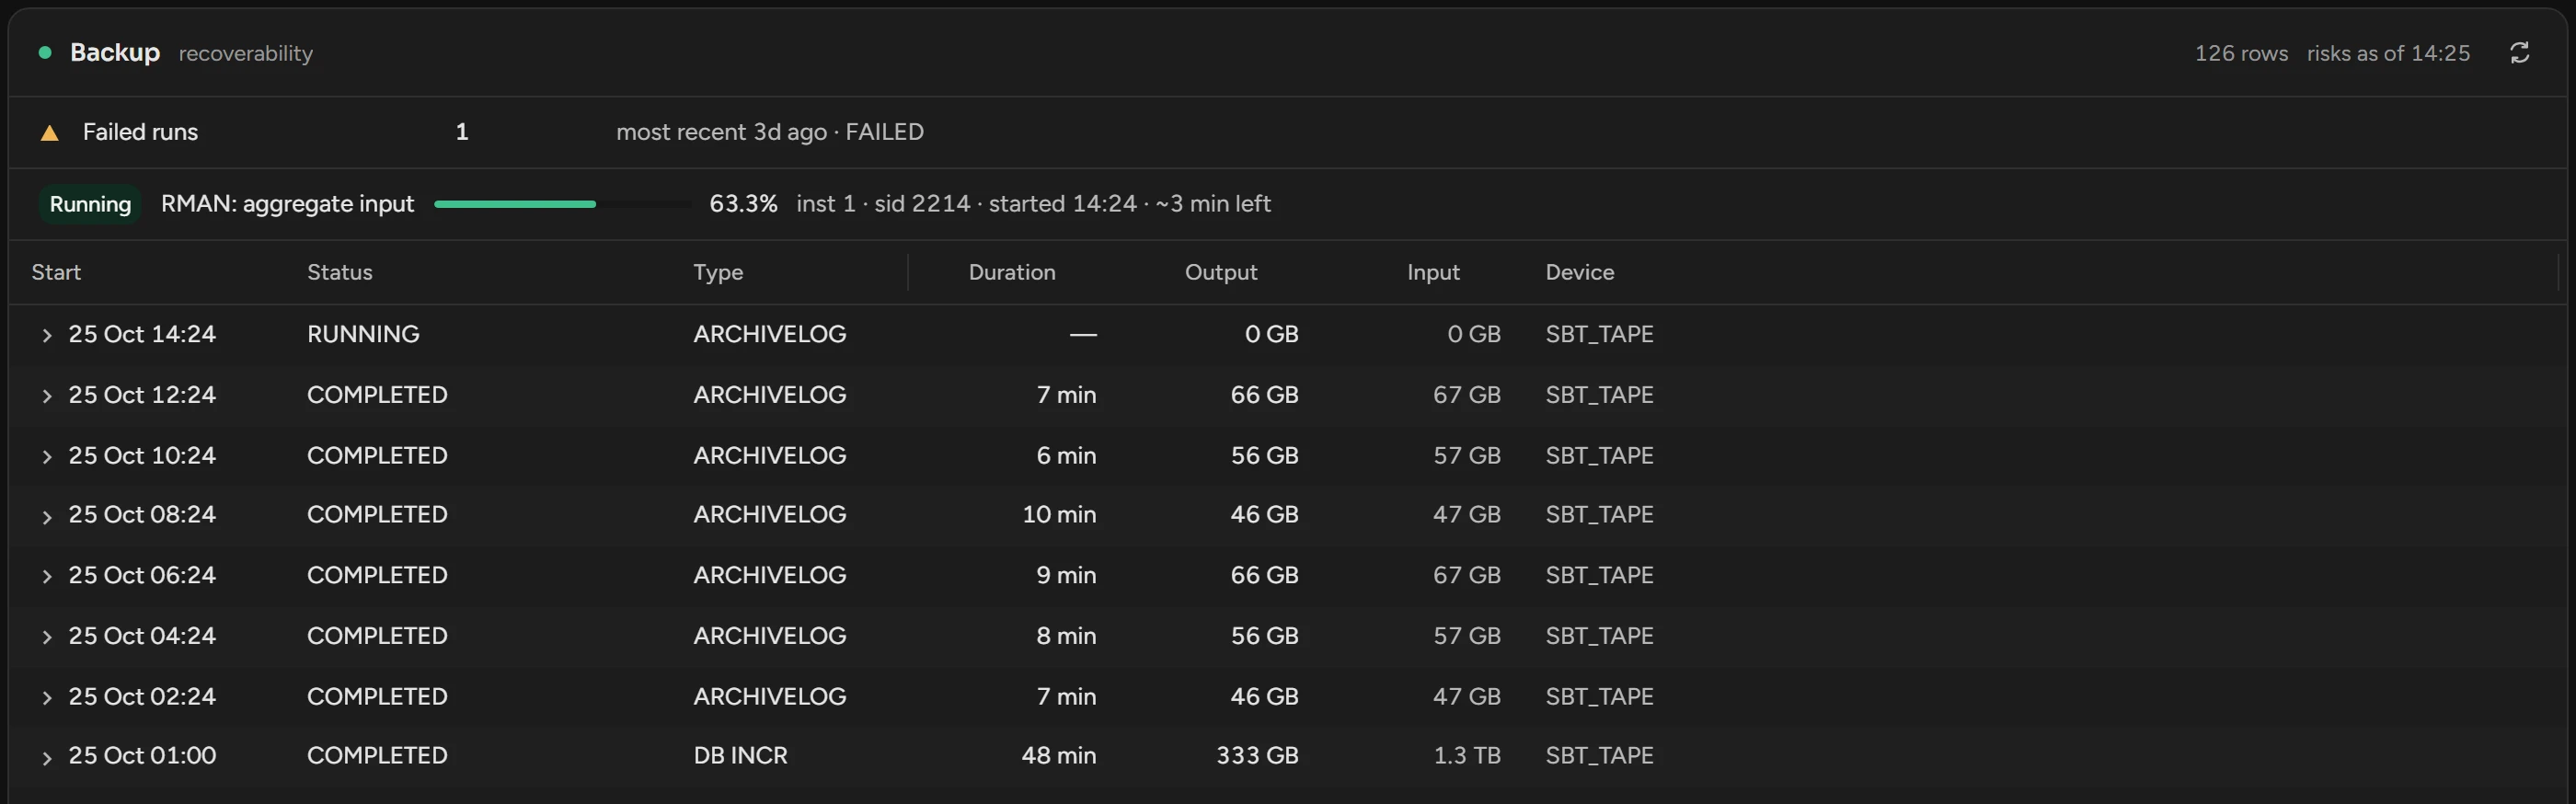
The RMAN history shows the newest run first, and Running for a job in progress. The block at the top shows what needs attention:
- a Last full older than 8 days;
- a Last incremental older than 36 hours;
- a Last archive log older than 6 hours;
- Failed runs.
A pluggable database shows its own backups and the archived-log backups of its container. You do not have to add the container. Backups taken on a standby in Scops show in a Taken On column. If a standby that is not in Scops takes the backups, the tab gives its name and the backup age is the age of the last archivelog backup.
Check the standby
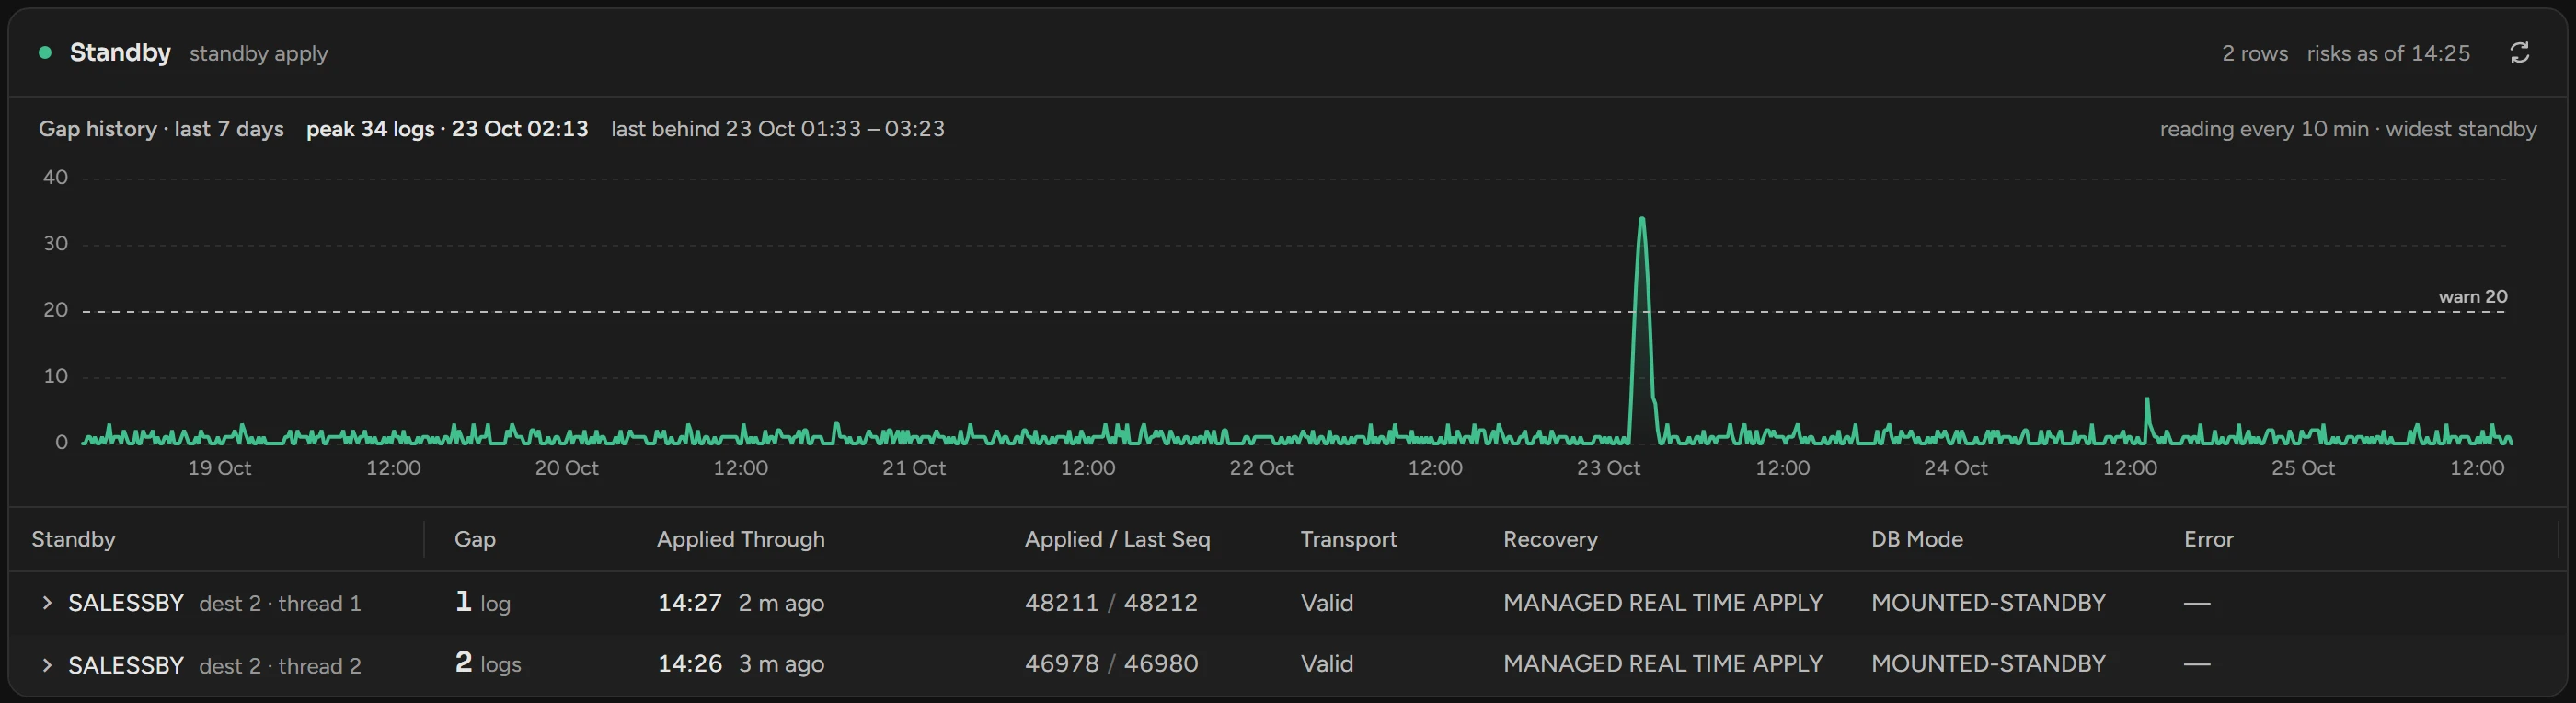
Each destination and thread shows the Gap in logs, Applied Through, Transport, Recovery (red when apply stopped) and Error. Open a row to see if the gap is in transport or in apply.
Gap history shows the widest gap over the last 7 days, while the Cache switch is on.
Related
Updated November 3, 2026