Jobs
See what each job does on each database, act on a job that is stuck or fails, and set the schedule of each job.
Before you begin
You need Manage Settings. The page refreshes every five seconds.
Find a job that needs you
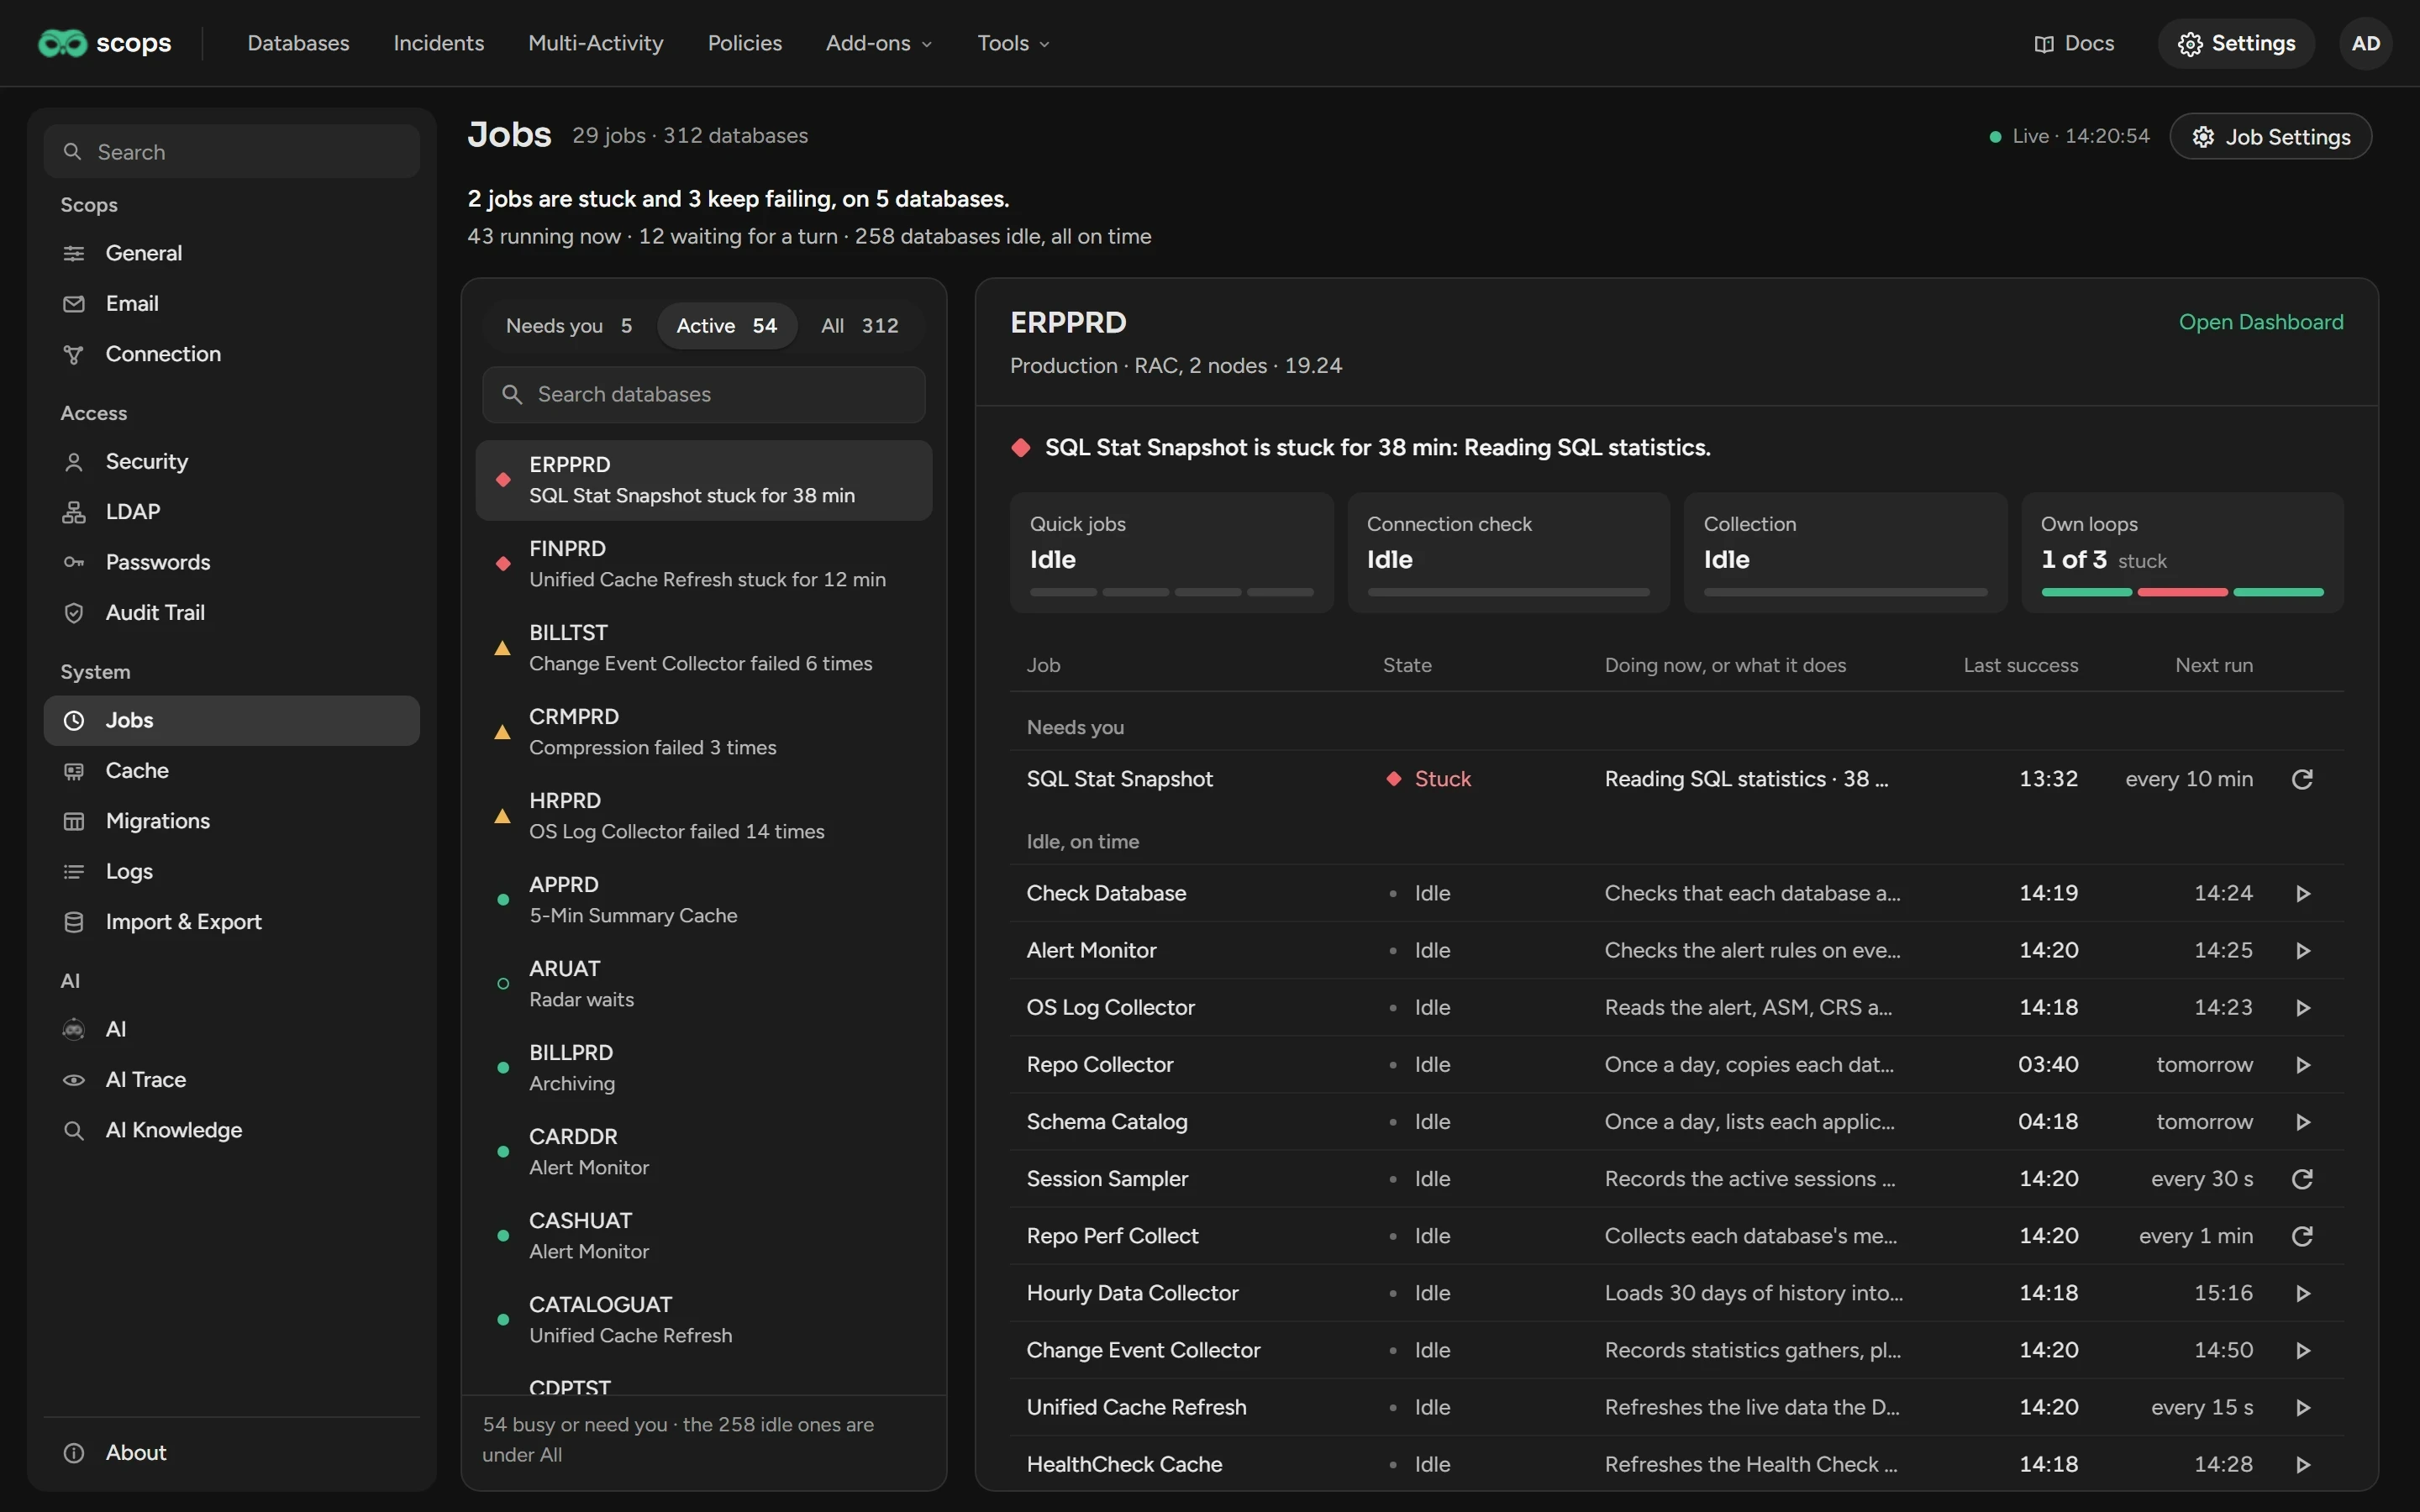
Open Settings › Jobs.
Under Needs you, click a database. Active and All show more databases.
On the right, read the jobs under Needs you. Each row gives the state and the reason.
Run or restart a job
Click the icon at the end of the job row. Point to it first to see what it does.
| Job | What the icon does |
|---|---|
| A job with its own thread on each database | Restarts the job on this database only. It starts again within a minute. |
| A stuck job | Restarts the job on every database, after you confirm. Scops drops the work that is stuck. |
| Any other job | Runs the job on this database now. |
Change the schedule of a job
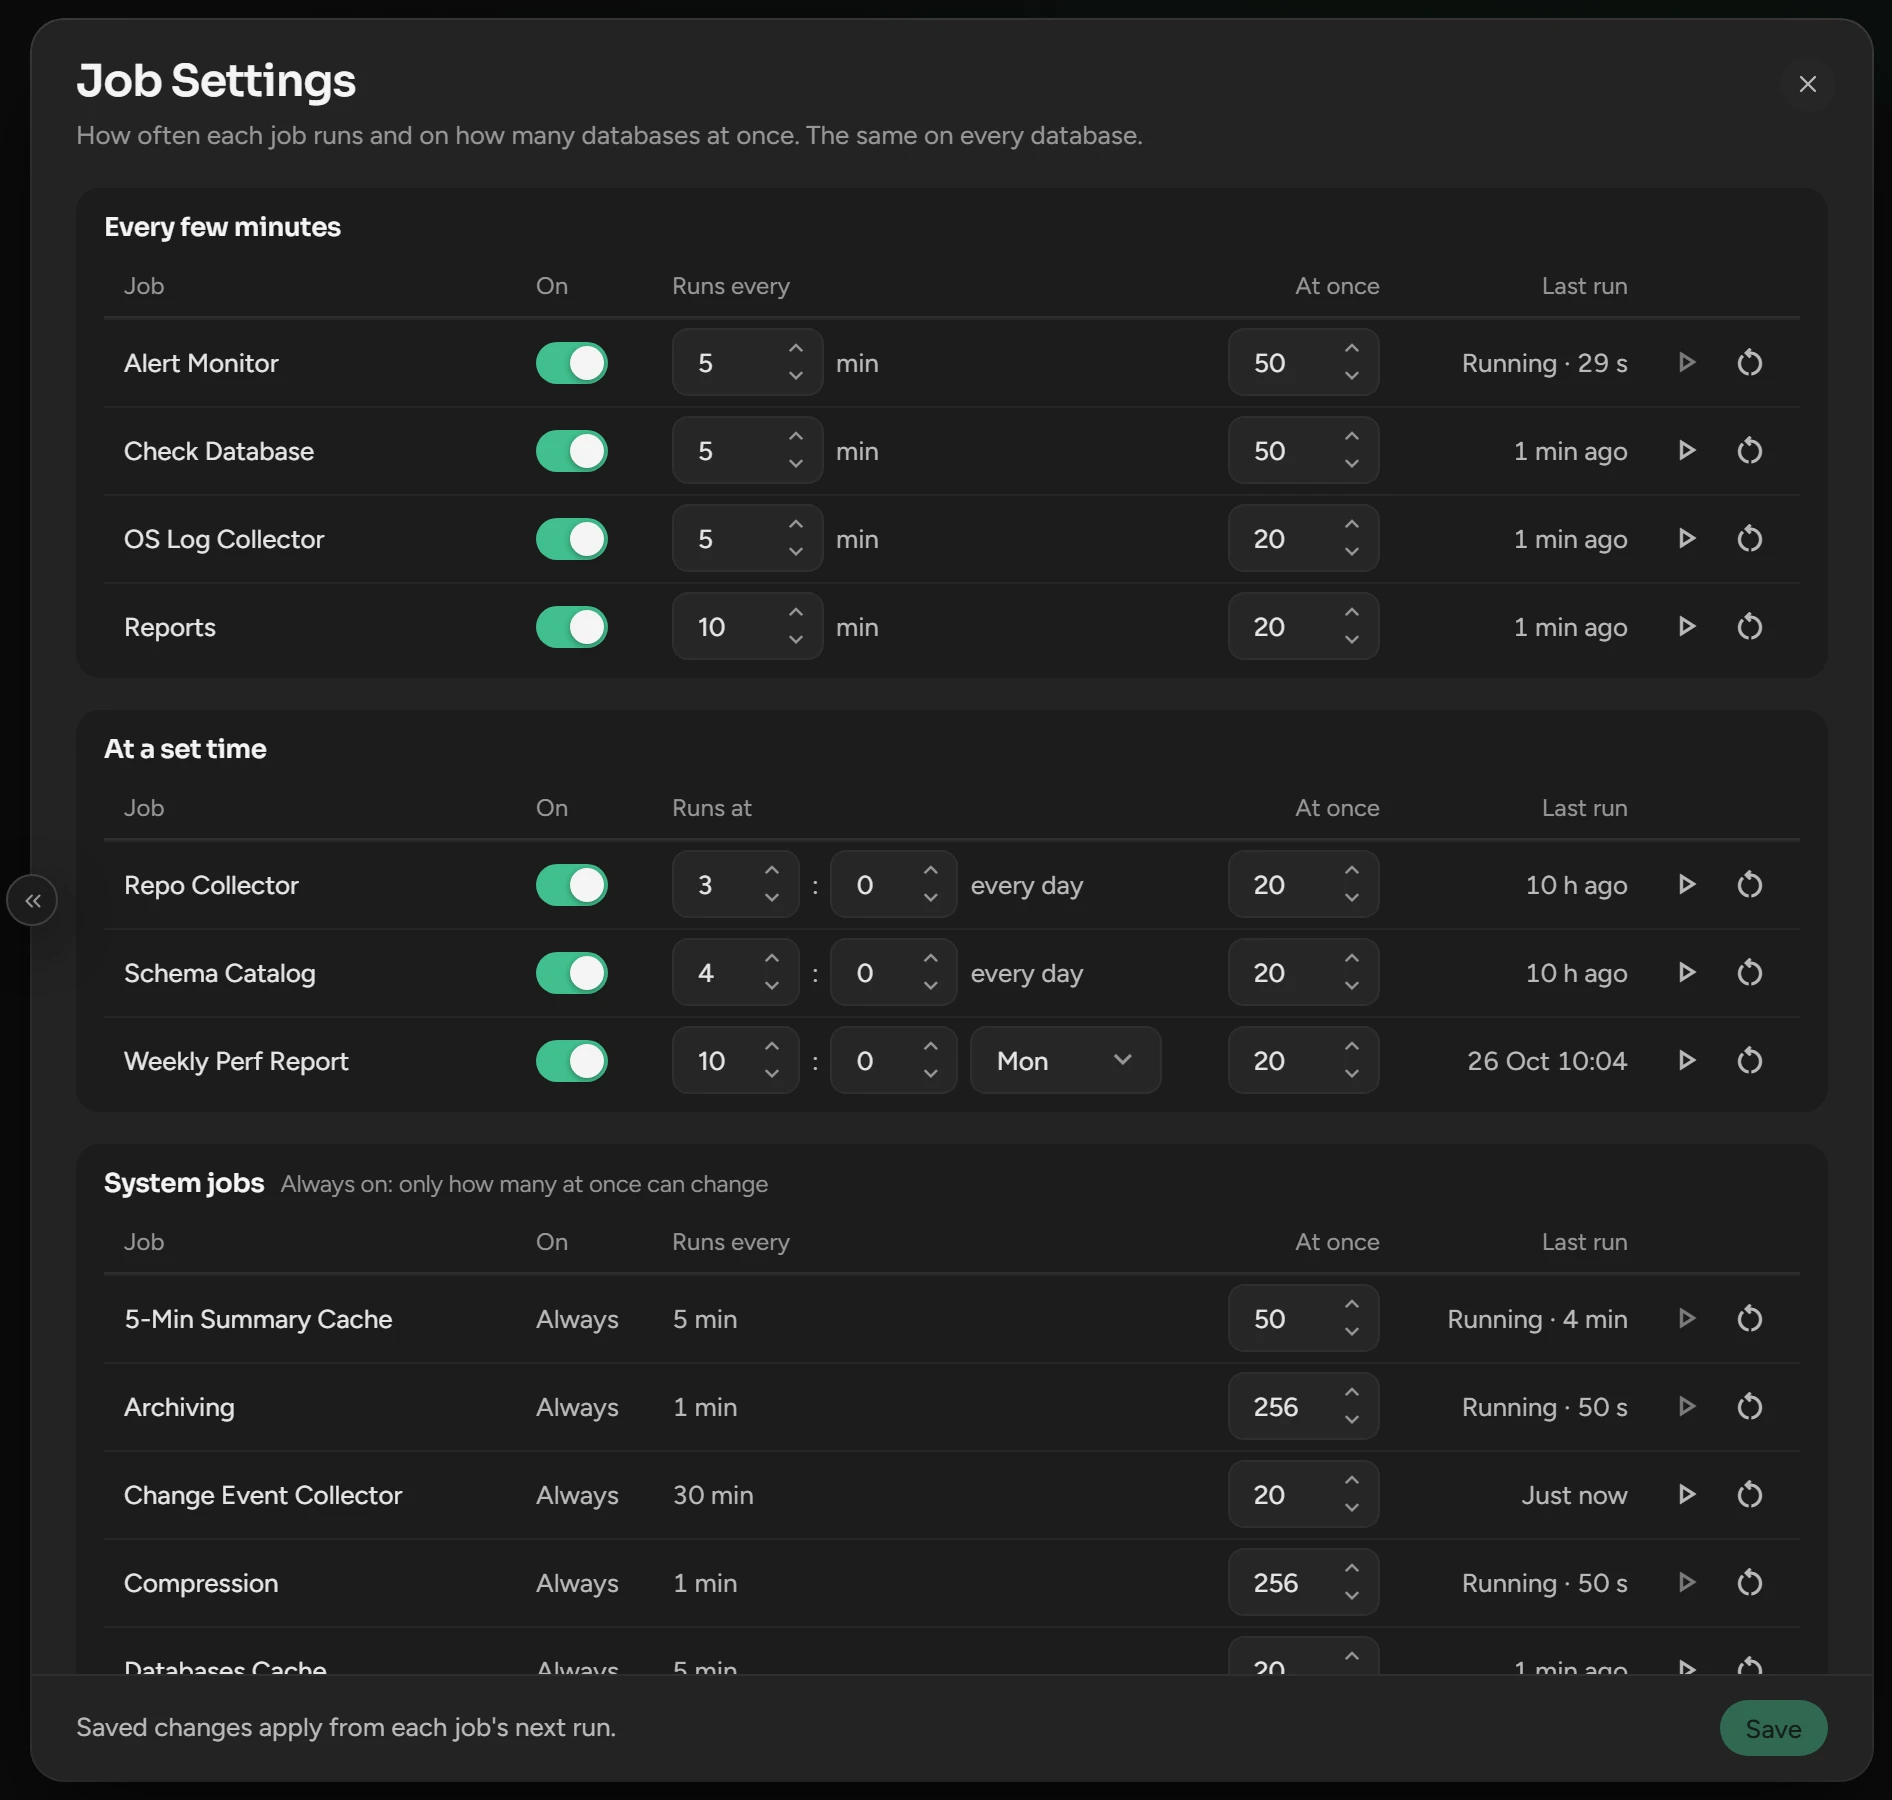
Click Job Settings at the top right.
Change On, Runs every, Runs at or At once.
Click Save.
A change applies from the next run. Runs every is 1 to 1,440 minutes, and At once is 1 to 500 databases at the same time. A system job is always on: only its At once can change.
What you see
| State | Meaning |
|---|---|
| Stuck | A call did not return within the time limit of the job. |
| Failed n times, Failing | The last runs on this database failed. |
| Running | The job works on the database now. |
| Waiting | The job waits for a free thread, or a free place in its At once. |
| Idle | The job is on time. |
| Switched off, Not set up | The job is off, or it does not work on this database. |
A red slot in the thread blocks is a stuck call. If a database is still busy at the next run, the job skips it. The other databases do not wait.
Every job
| Job | Default schedule | At once | What it does |
|---|---|---|---|
| Every few minutes | |||
| Alert Monitor | 5 min | 50 | Checks the alert rules. |
| Check Database | 5 min | 50 | Checks that each database answers. |
| OS Log Collector | 5 min | 20 | Reads the OS logs over SSH. |
| Reports | 10 min | 20 | Runs the scheduled reports. |
| At a set time | |||
| Repo Collector | Daily 03:00 | 20 | Inventory, sizes, license use, services. |
| Schema Catalog | Daily 04:00 | 20 | The objects for the Objects page. |
| Weekly Perf Report | Monday 10:00 | 20 | The weekly performance report. |
| System jobs | |||
| 5-Min Summary Cache | 5 min | 50 | 5-minute and hourly activity in memory. |
| Archiving | 1 min | 256 | Copies old rows to the archive database. |
| Change Event Collector | 10 min | 20 | Plan changes. Statistics gathers, parameter changes and DDL every 30 min. |
| Compression | 1 min | 256 | Runs Compression after you start it. |
| Databases Cache | 5 min | 20 | The totals for all databases. |
| HealthCheck Cache | 10 min | 50 | The Health Check data. |
| Hourly Data Collector | 1 hour | 20 | 30 days of history for Ask Scops. |
| Insights SqlStat Cache | 10 min | 20 | The heaviest statements for Insights. |
| Page Cache | 1 hour | 20 | The Overview, Services and Objects pages. |
| Pool Occupancy | 5 min | 20 | How full each connection pool is. |
| Radar | 5 min | 20 | Runs Radar Engine. |
| Recompress Analysis | 4 hours | 20 | Tables to compress again. |
| Repo Perf Collect | 1 min | Each its own | Metrics and space history. |
| Repo Rollup | 1 min | 20 | 5-minute and hourly totals, and removal of old data. |
| Repository Audit | 5 min | 20 | The seals of the Audit Trail. |
| Self-Heal | 1 hour | 20 | Keeps the repository healthy. |
| Session Sampler | 30 s | Each its own | The active sessions. |
| Sizing Cache | 1 hour | 20 | The last-week view of Sizing. |
| SQL Stat Snapshot | 10 min | Each its own | The statistics of each SQL statement. |
| Statistics | 1 min | 256 | Gathers stale and missing statistics. |
| Summary Cache | 5 min | 20 | The Summary page. |
| System Health | 1 min | 20 | Checks the repository. See Health. |
| Unified Cache Refresh | 15 s | 50 | The live data of the Dashboard and Metrics. |
Each its own: the job has its own thread on each database.
Related
Updated November 9, 2026