Findings and forecasts
Use the Radar tab of Incidents to read the findings of Radar Engine, one risk on one database each, and to act on them.
Before you begin
- View Radar lets you read findings, and acknowledge, snooze, reopen, rate and mute them on one database.
- Manage Radar also lets you mute on all databases and open Radar Settings.
The Radar tab
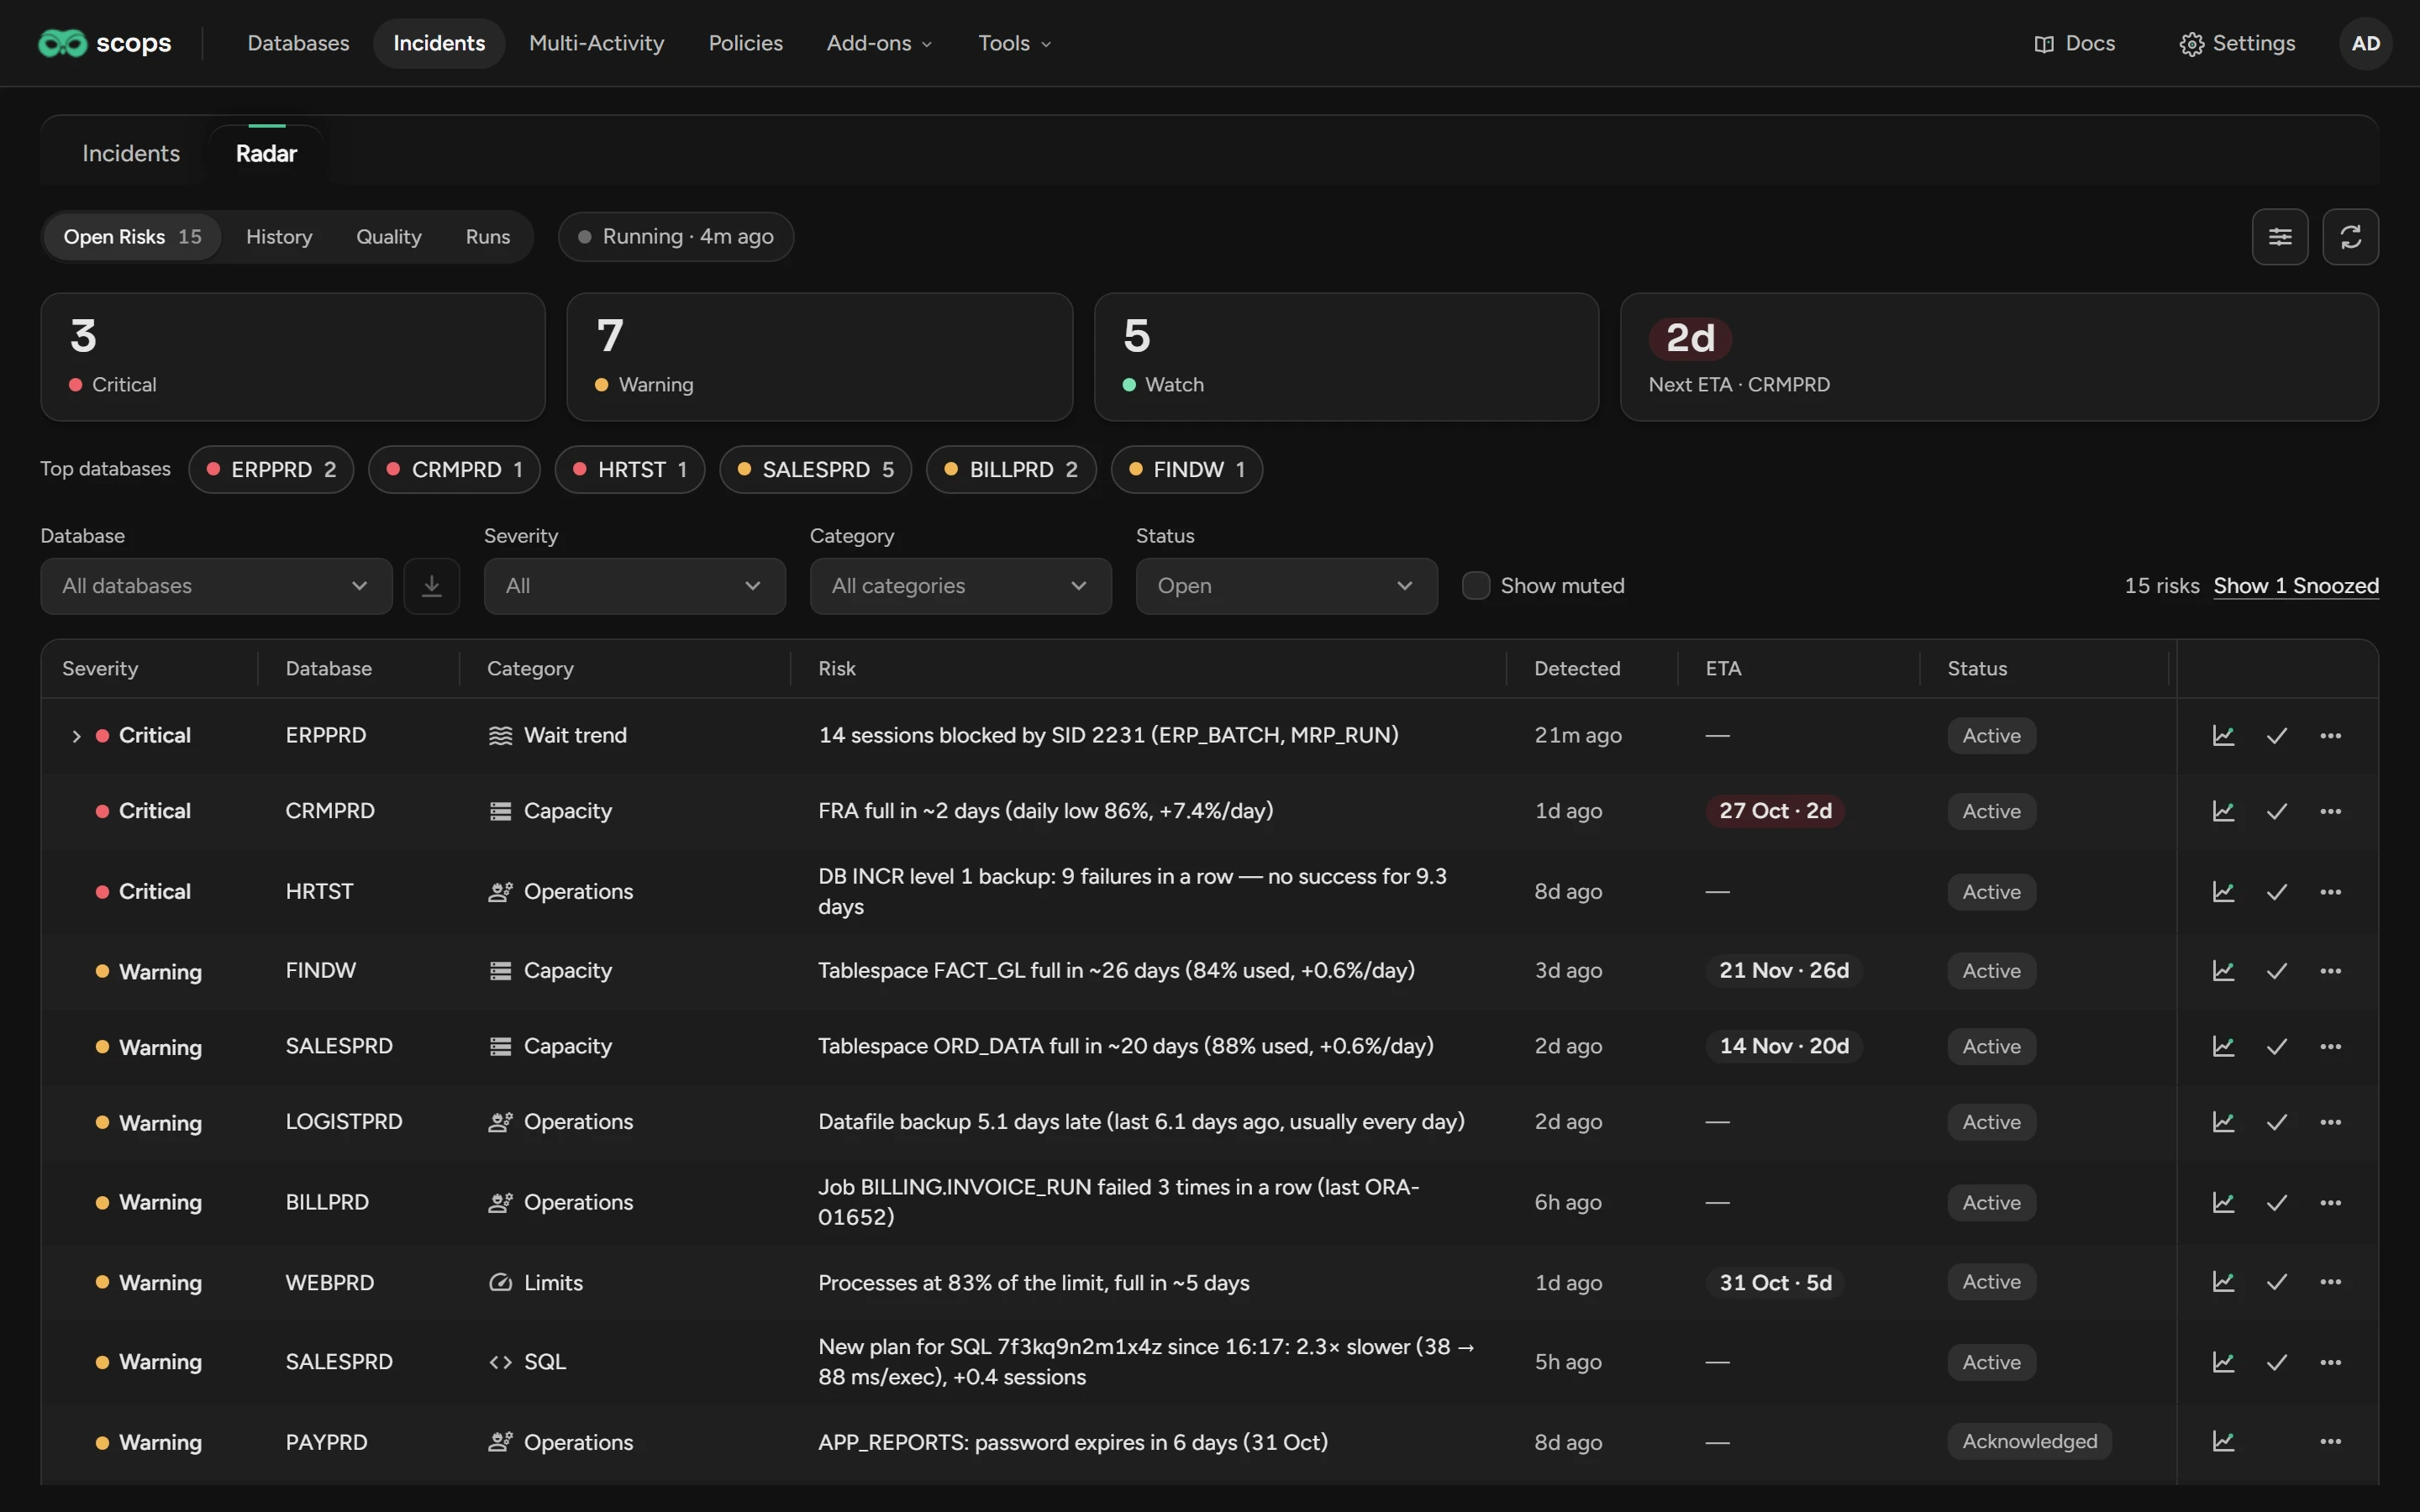
Open Incidents in the top bar and select Radar. Open Risks lists the open findings, and the ended findings of the last 30 days that reached Warning or Critical.
To filter the list, click a severity card or a database under Top databases. Or use the filters above the list.
To see only the ended findings, select Ended in Status. Clear Status to go back to All statuses.
To add the hidden findings, click Show N Snoozed or select Show muted.
Click a finding to open it. A row with an arrow is one incident: open it to see its findings.
Each finding shows the highest severity that it reached, in its color. An ended finding keeps this severity and color on the list, on the charts and in its dialog.
Next ETA opens the forecast with the nearest deadline. The chip next to the views shows if Radar runs.
Read a finding
The title of a finding is one sentence with the object and the numbers. Where space is small, Scops shows a headline first:
| Headline | Rest of the sentence |
|---|---|
| Tablespace ORD_DATA filling up | Full in ~20 days (88% used, +0.6%/day) |
| Sessions blocked | 14 sessions blocked by SID 2231 (ERP_BATCH, MRP_RUN) |
A finding also has a severity, a category, the time that Radar detected it and, for a forecast, an ETA.
The finding dialog
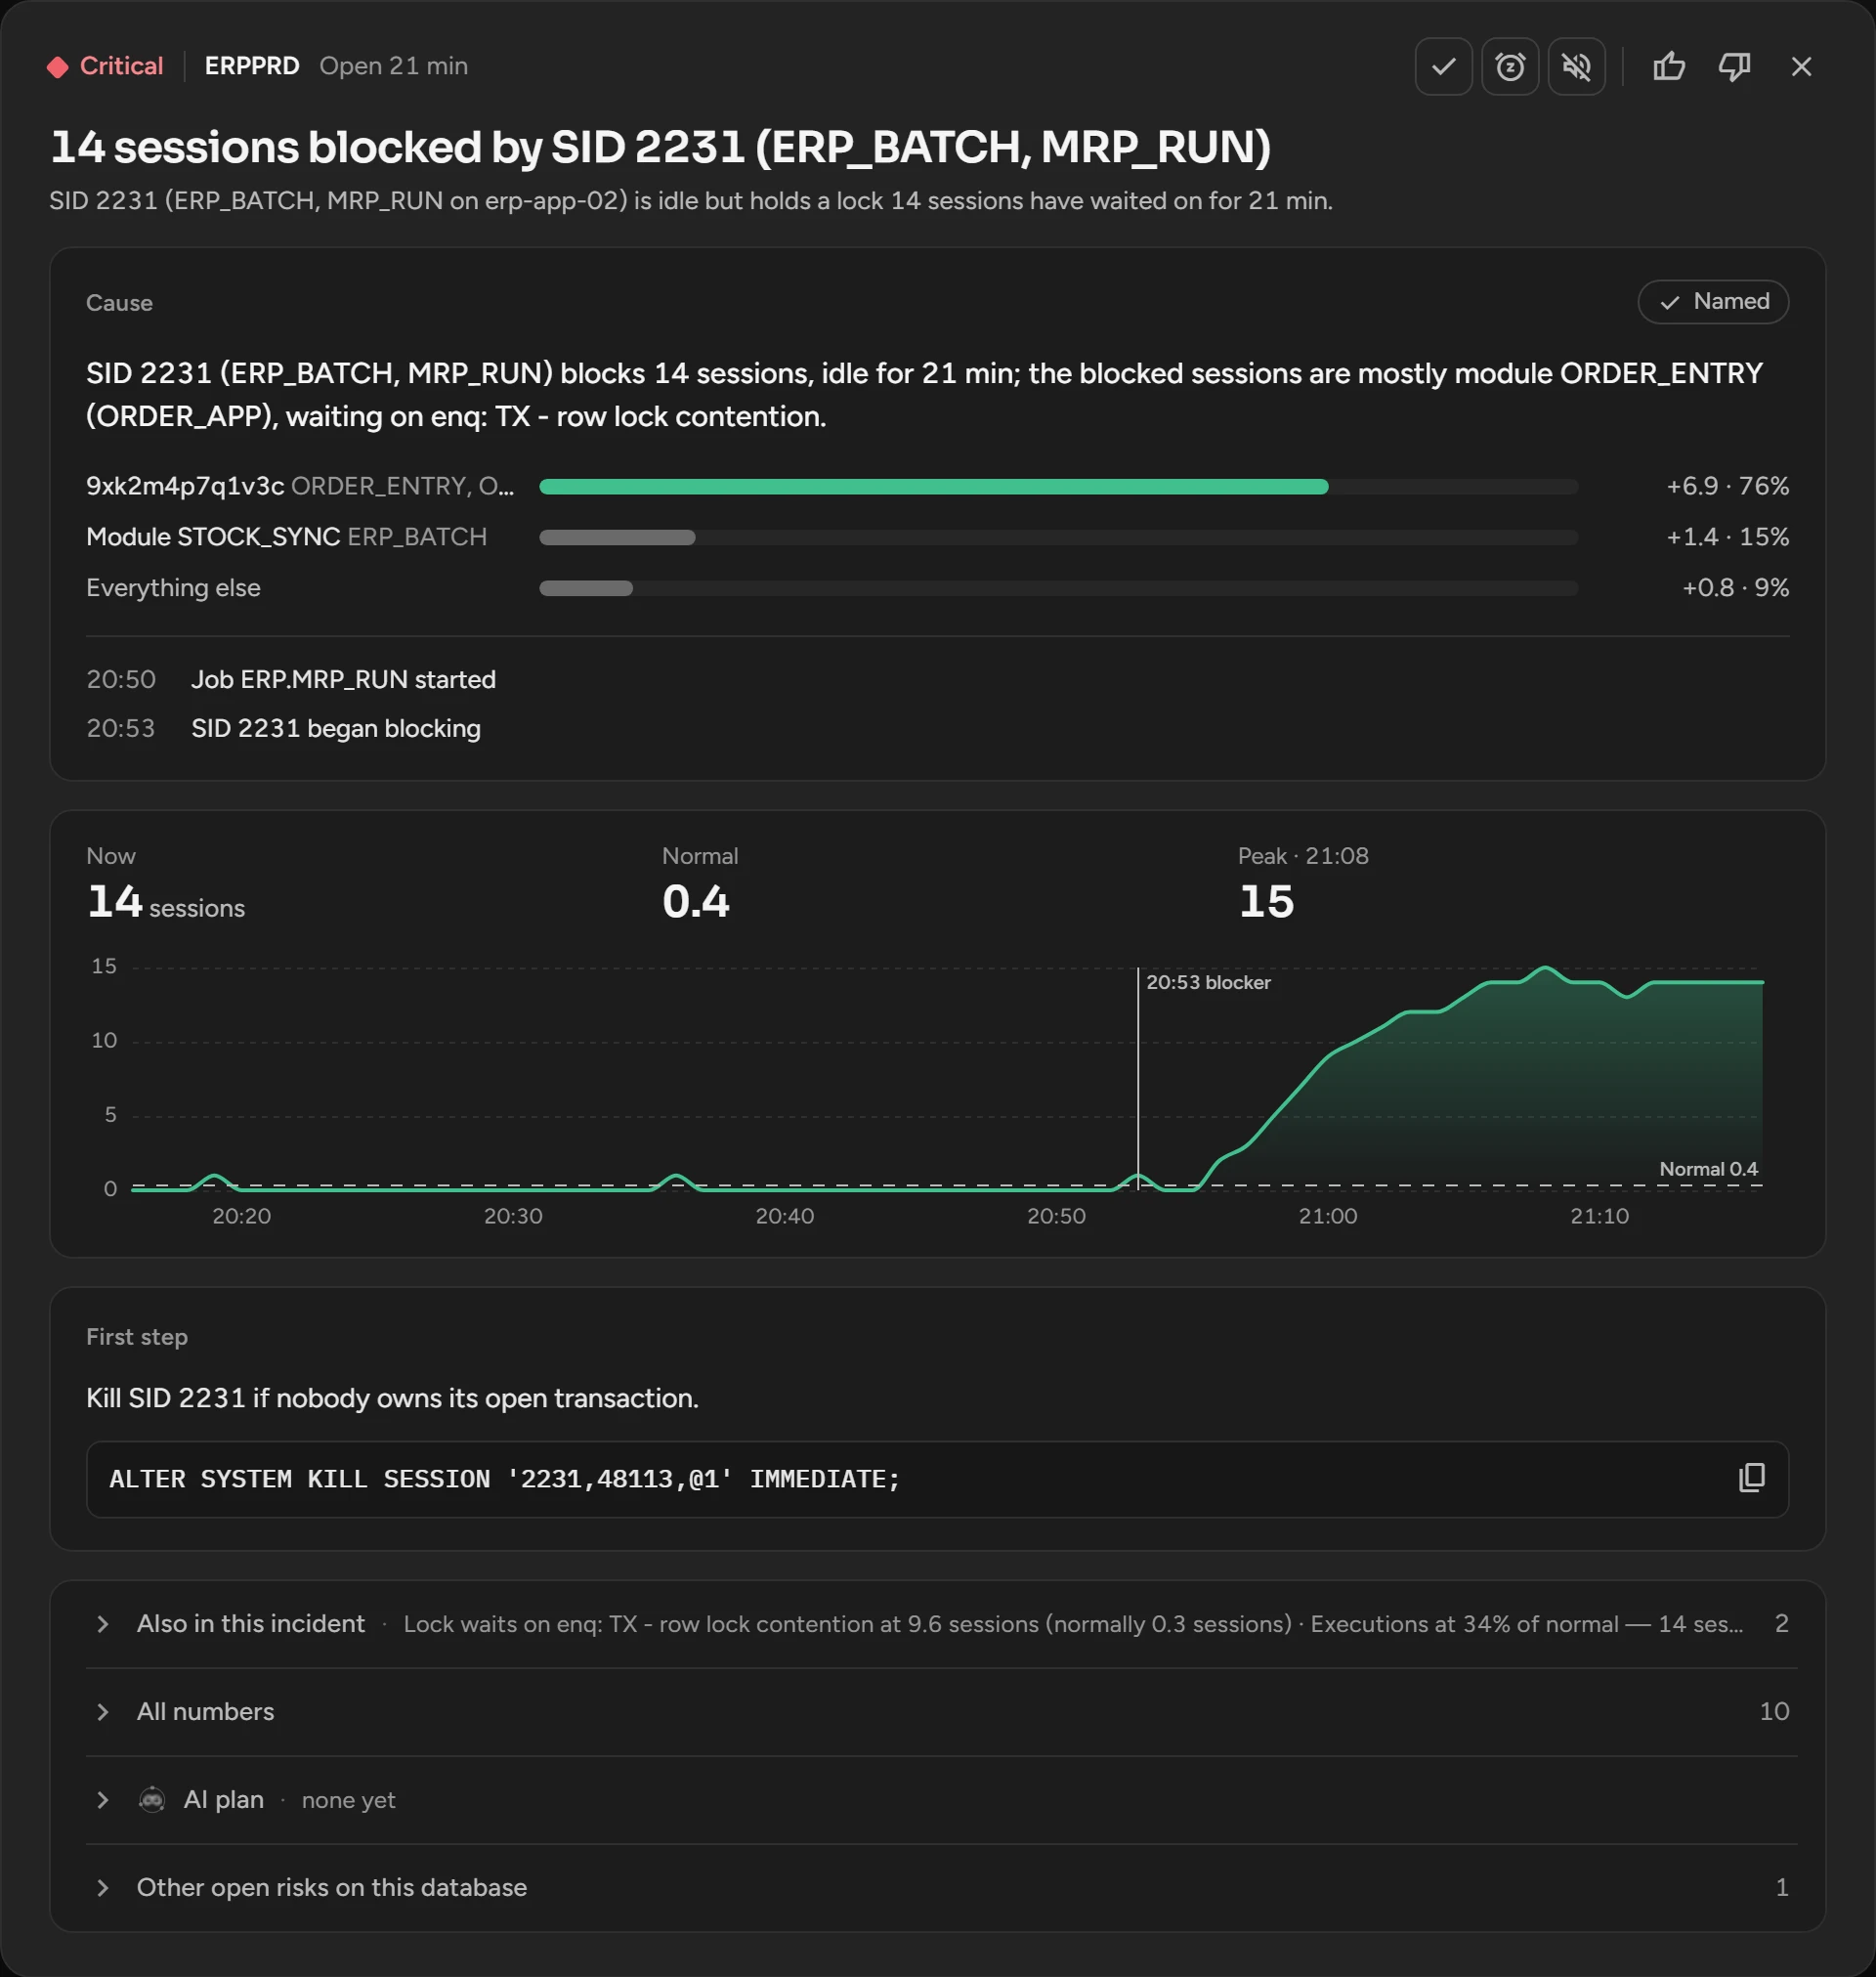
| Part | What it shows |
|---|---|
| Panel on the left | The open findings of the database. On the Dashboard, also the plan changes of the window. Click a row to read it. |
| Header | The severity, the database, the state, the actions, Real, False alarm and Close. |
| Cause | The cause with its grade, and what changed and when. Without a cause, What happened. |
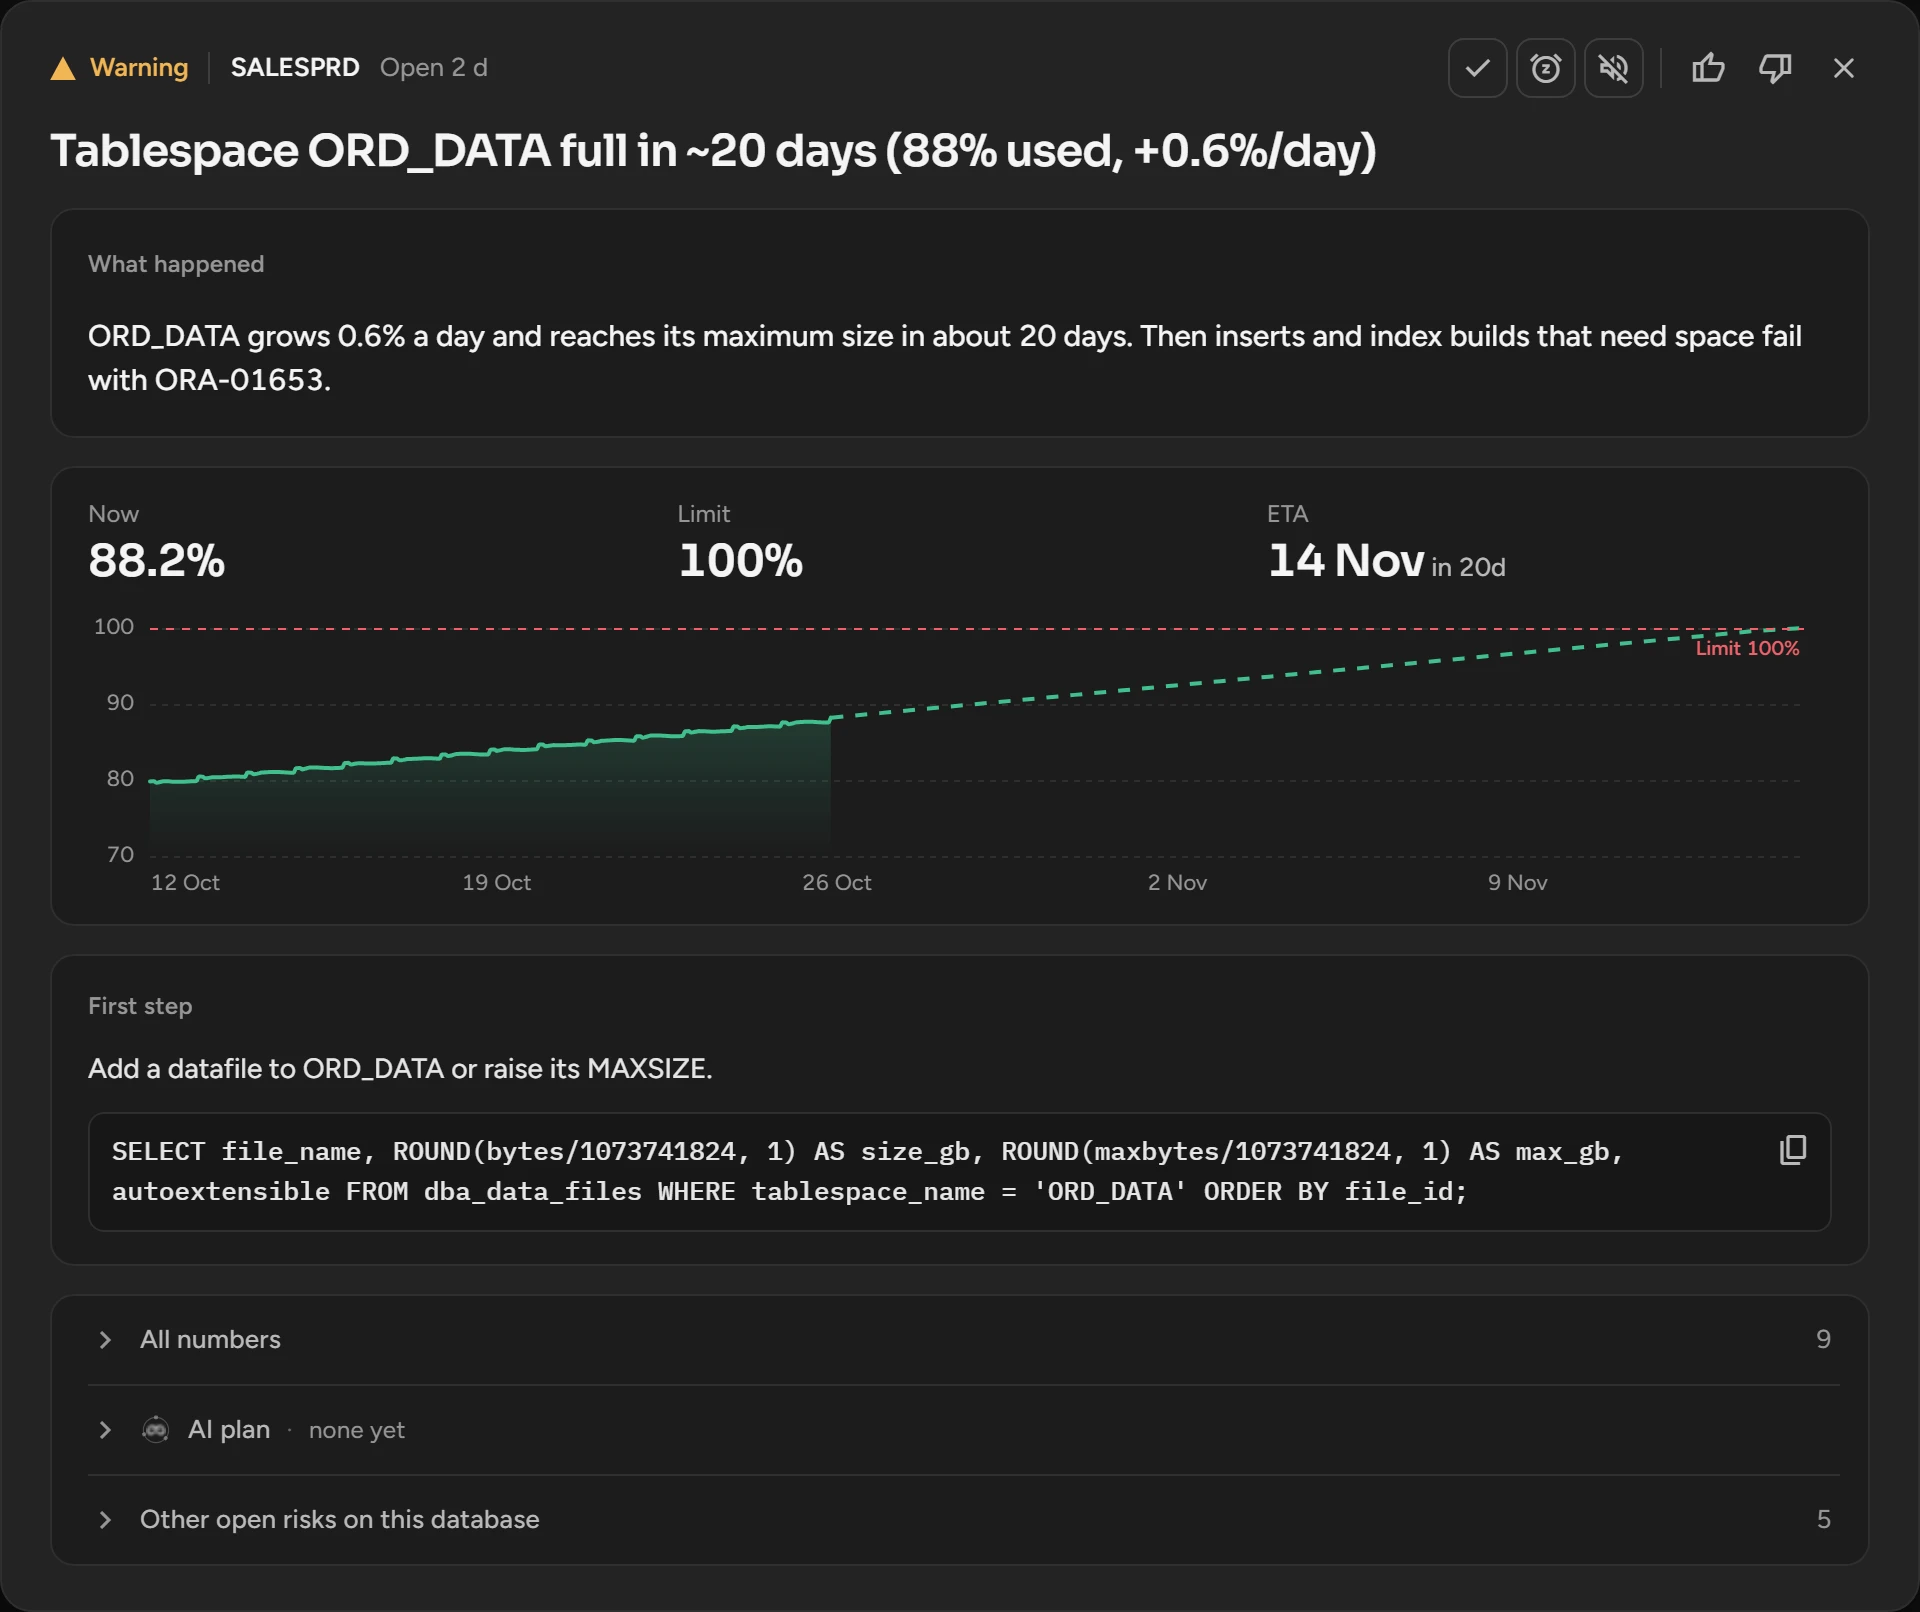
| Numbers and chart | Now, the Limit or Normal, and the ETA or Peak. A forecast shows the trend to the limit. |
| First step | What to do first, with its command to copy. Scops never runs it. |
| Also in this incident | The other findings of the incident, for example the slow statements behind a blocking chain. |
| All numbers | All readings, the full explanation and the other steps. |
| AI plan | Generate Plan asks Scops AI for a plan. You need Use AI. |
A mark on a chart can open an earlier episode. Then click Open It to open the latest episode, which has the actions.
Act on a finding
The actions are in the dialog header, and on each row: Acknowledge, and a menu with Snooze, Mute and Reopen.
| Action | What it does | Undo | |
|---|---|---|---|
| Acknowledge | Marks the finding as seen. It stays open. | Not again, unless it becomes worse | Reopen |
| Snooze | Hides the finding, up to 30 days. | Not during the snooze, unless it becomes worse | Reopen |
| Mute (this database) | Ends the finding. The database never raises this risk again. | Never | Unmute |
| Mute (all databases) | Adds the key of the finding to the exclusions. | Never | Edit the exclusions |
| Real, False alarm | Rates the finding for Quality. | After a false alarm, only Critical for 30 days | Click again |
A finding that becomes worse loses its acknowledgement, snooze and rating, and Radar mails it again. A forecast also loses its acknowledgement or snooze when its deadline suddenly comes within 48 hours.
Snooze a finding
Open the finding and click Snooze, or select Snooze in the row menu.
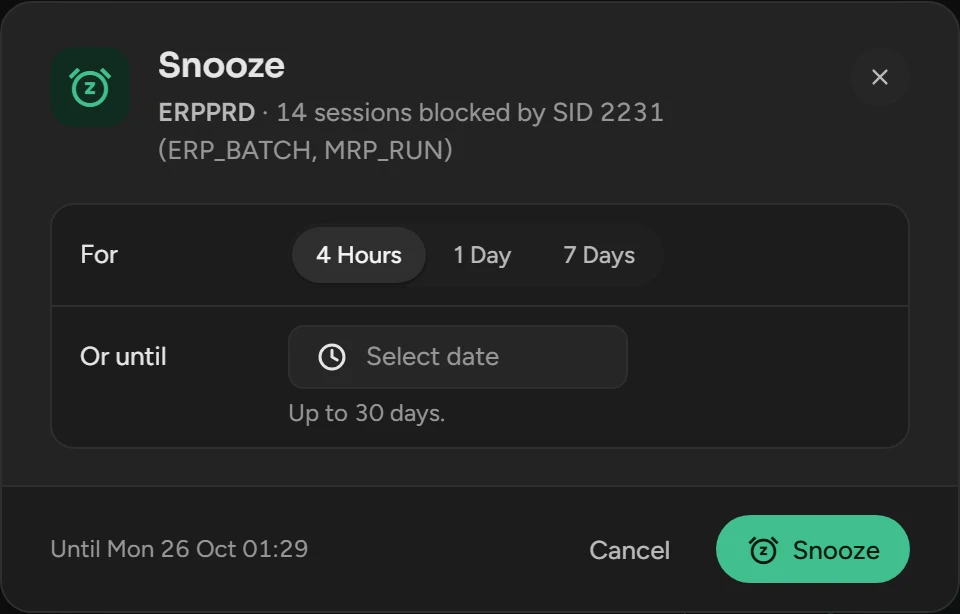
Select 4 Hours, 1 Day or 7 Days, or a date under Or until.
Click Snooze.
Mute a finding
Mute a risk that is expected, for example a nightly batch that always fills a staging tablespace. A mute is permanent and counts as a false alarm.
Open the finding and click Mute, or select Mute in the row menu.
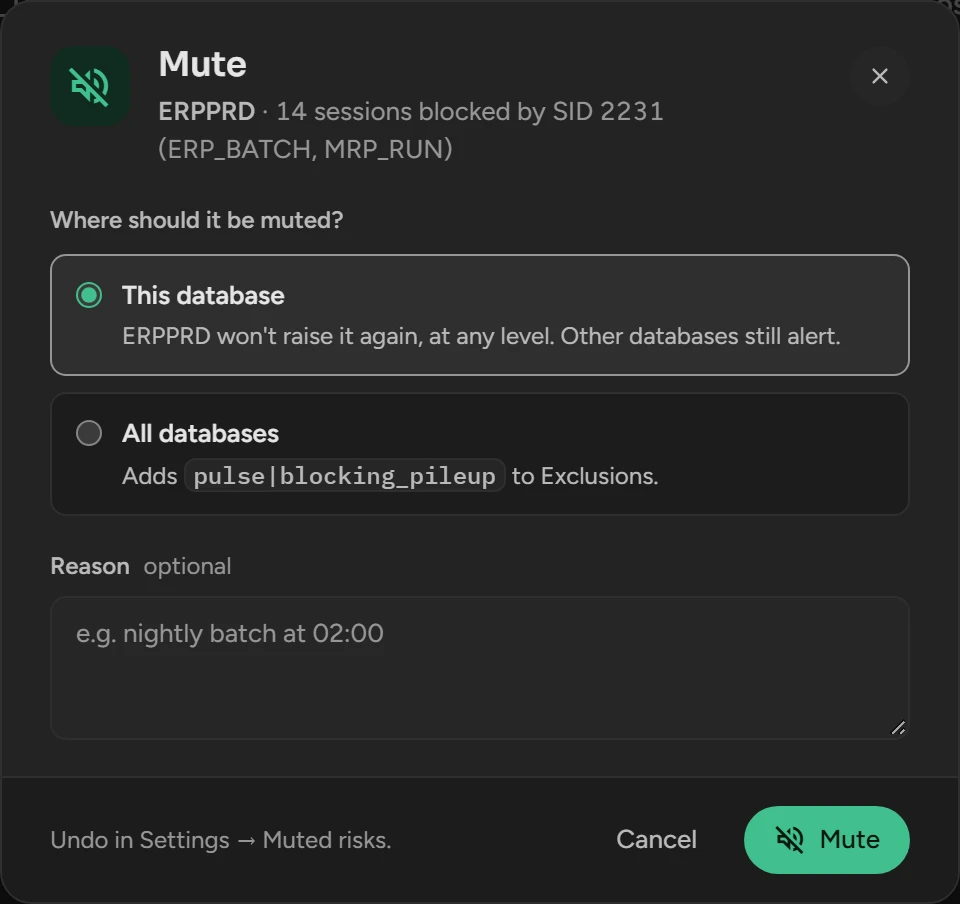
Select This database, or All databases if you have Manage Radar.
For one database, you can type a Reason.
Click Mute.
Review ended findings
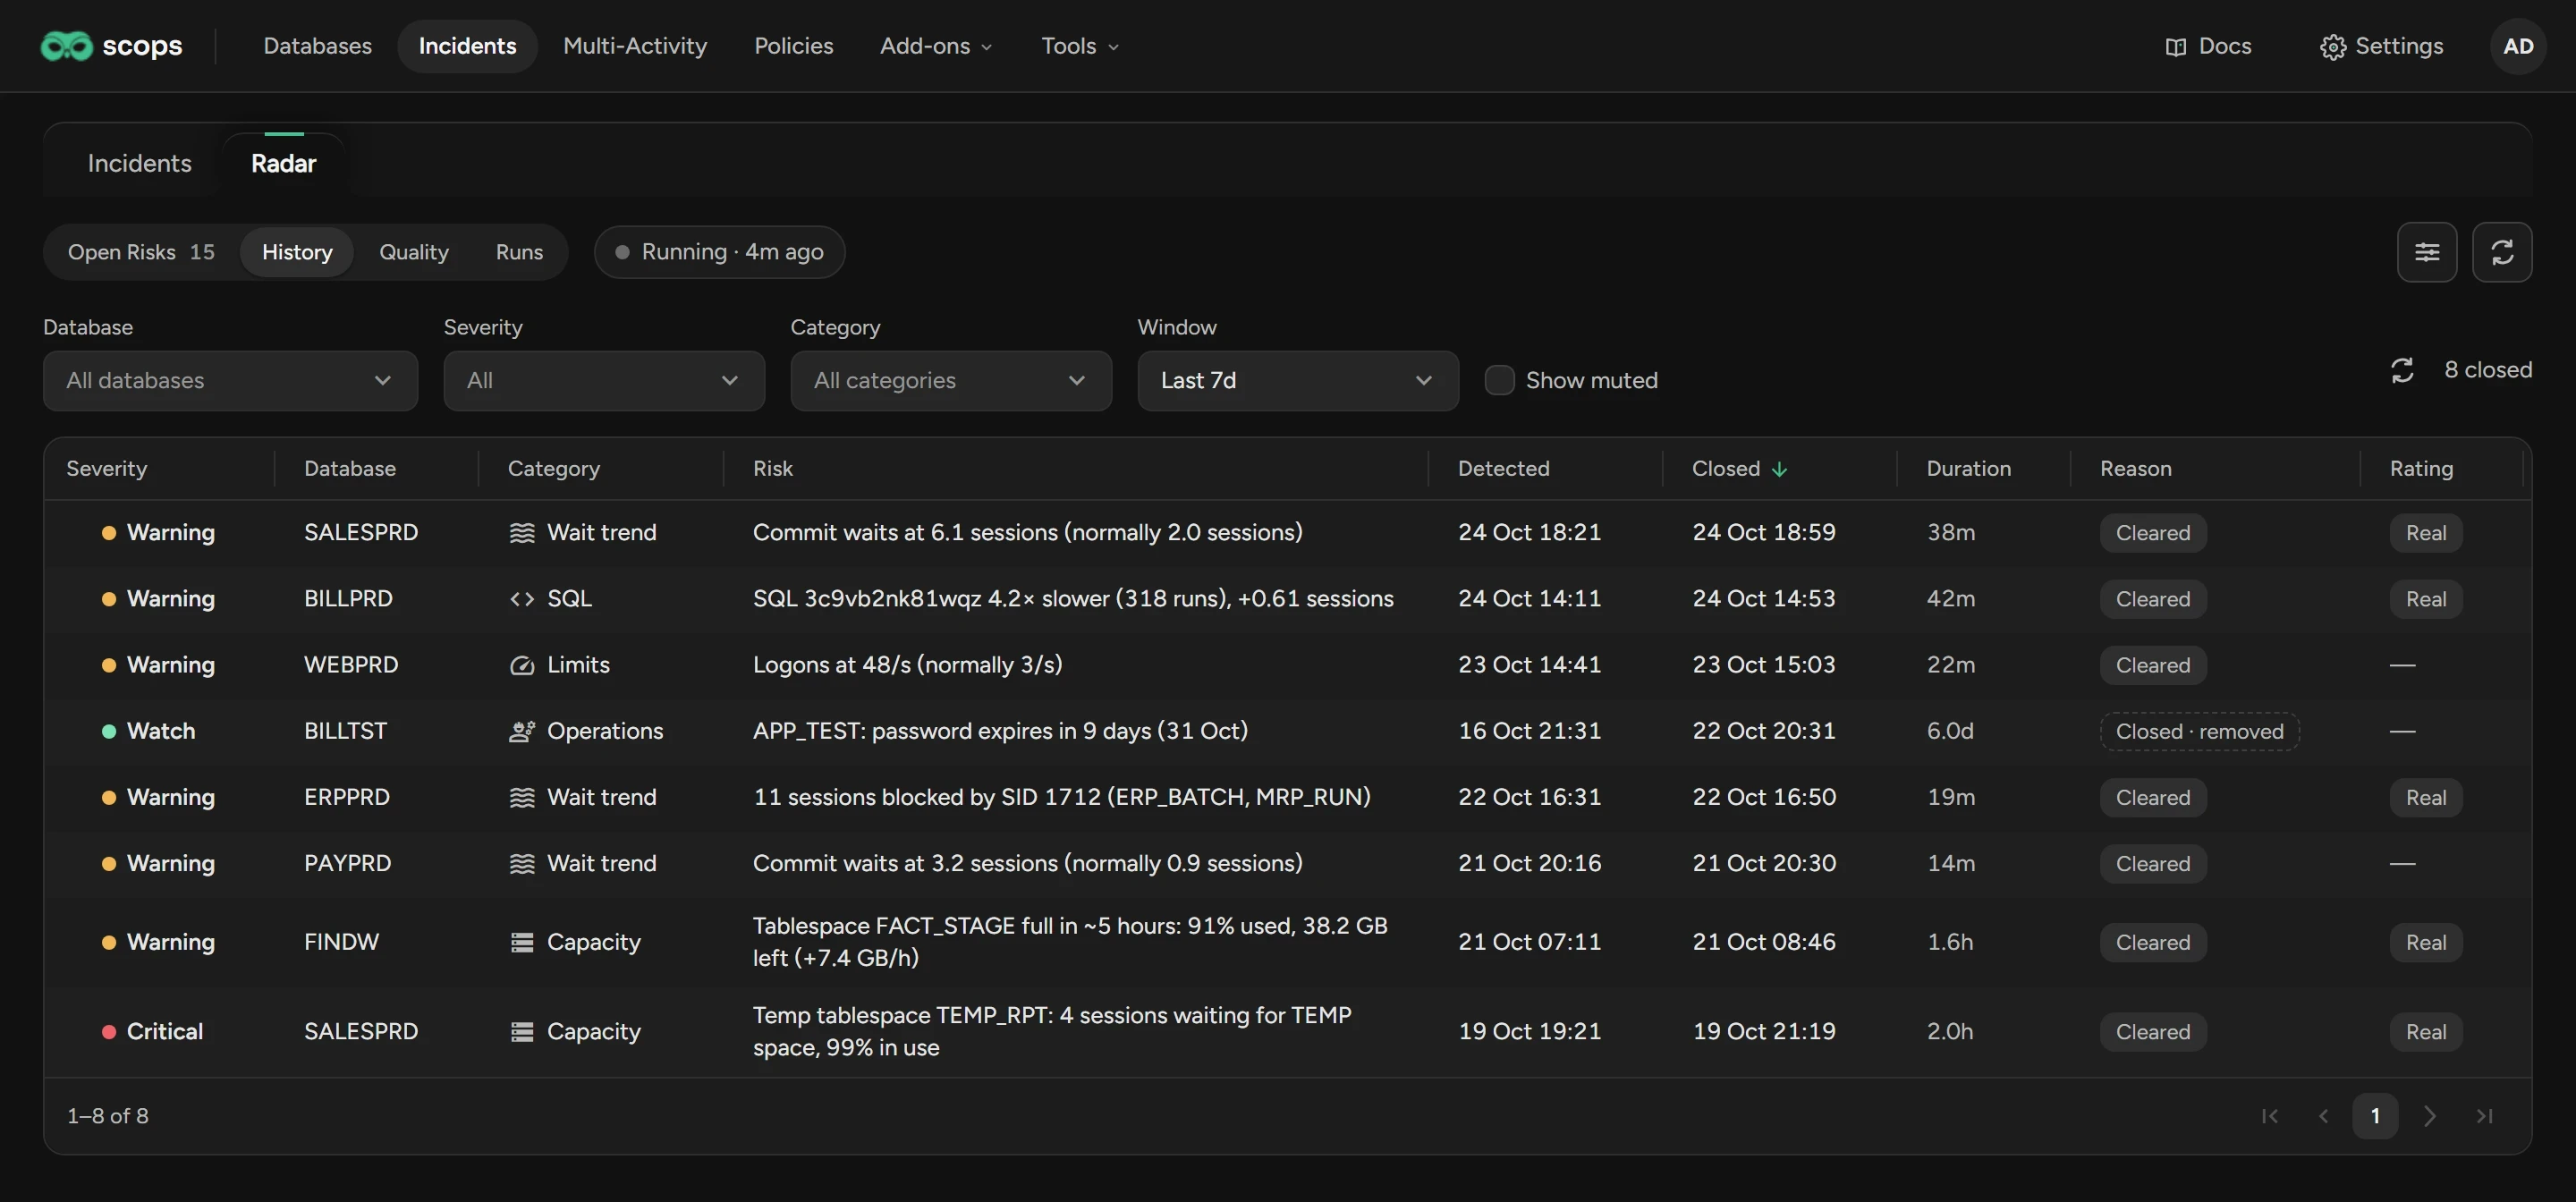
History lists the findings that ended in the Window, with the Reason (see How findings end) and the rating. Scops keeps them for 30 days from when Radar raised them.
Check the quality of findings
Quality counts the ratings for each category. Precision is the share of real findings among the rated ones. An acknowledgement counts as real, and a mute as a false alarm.
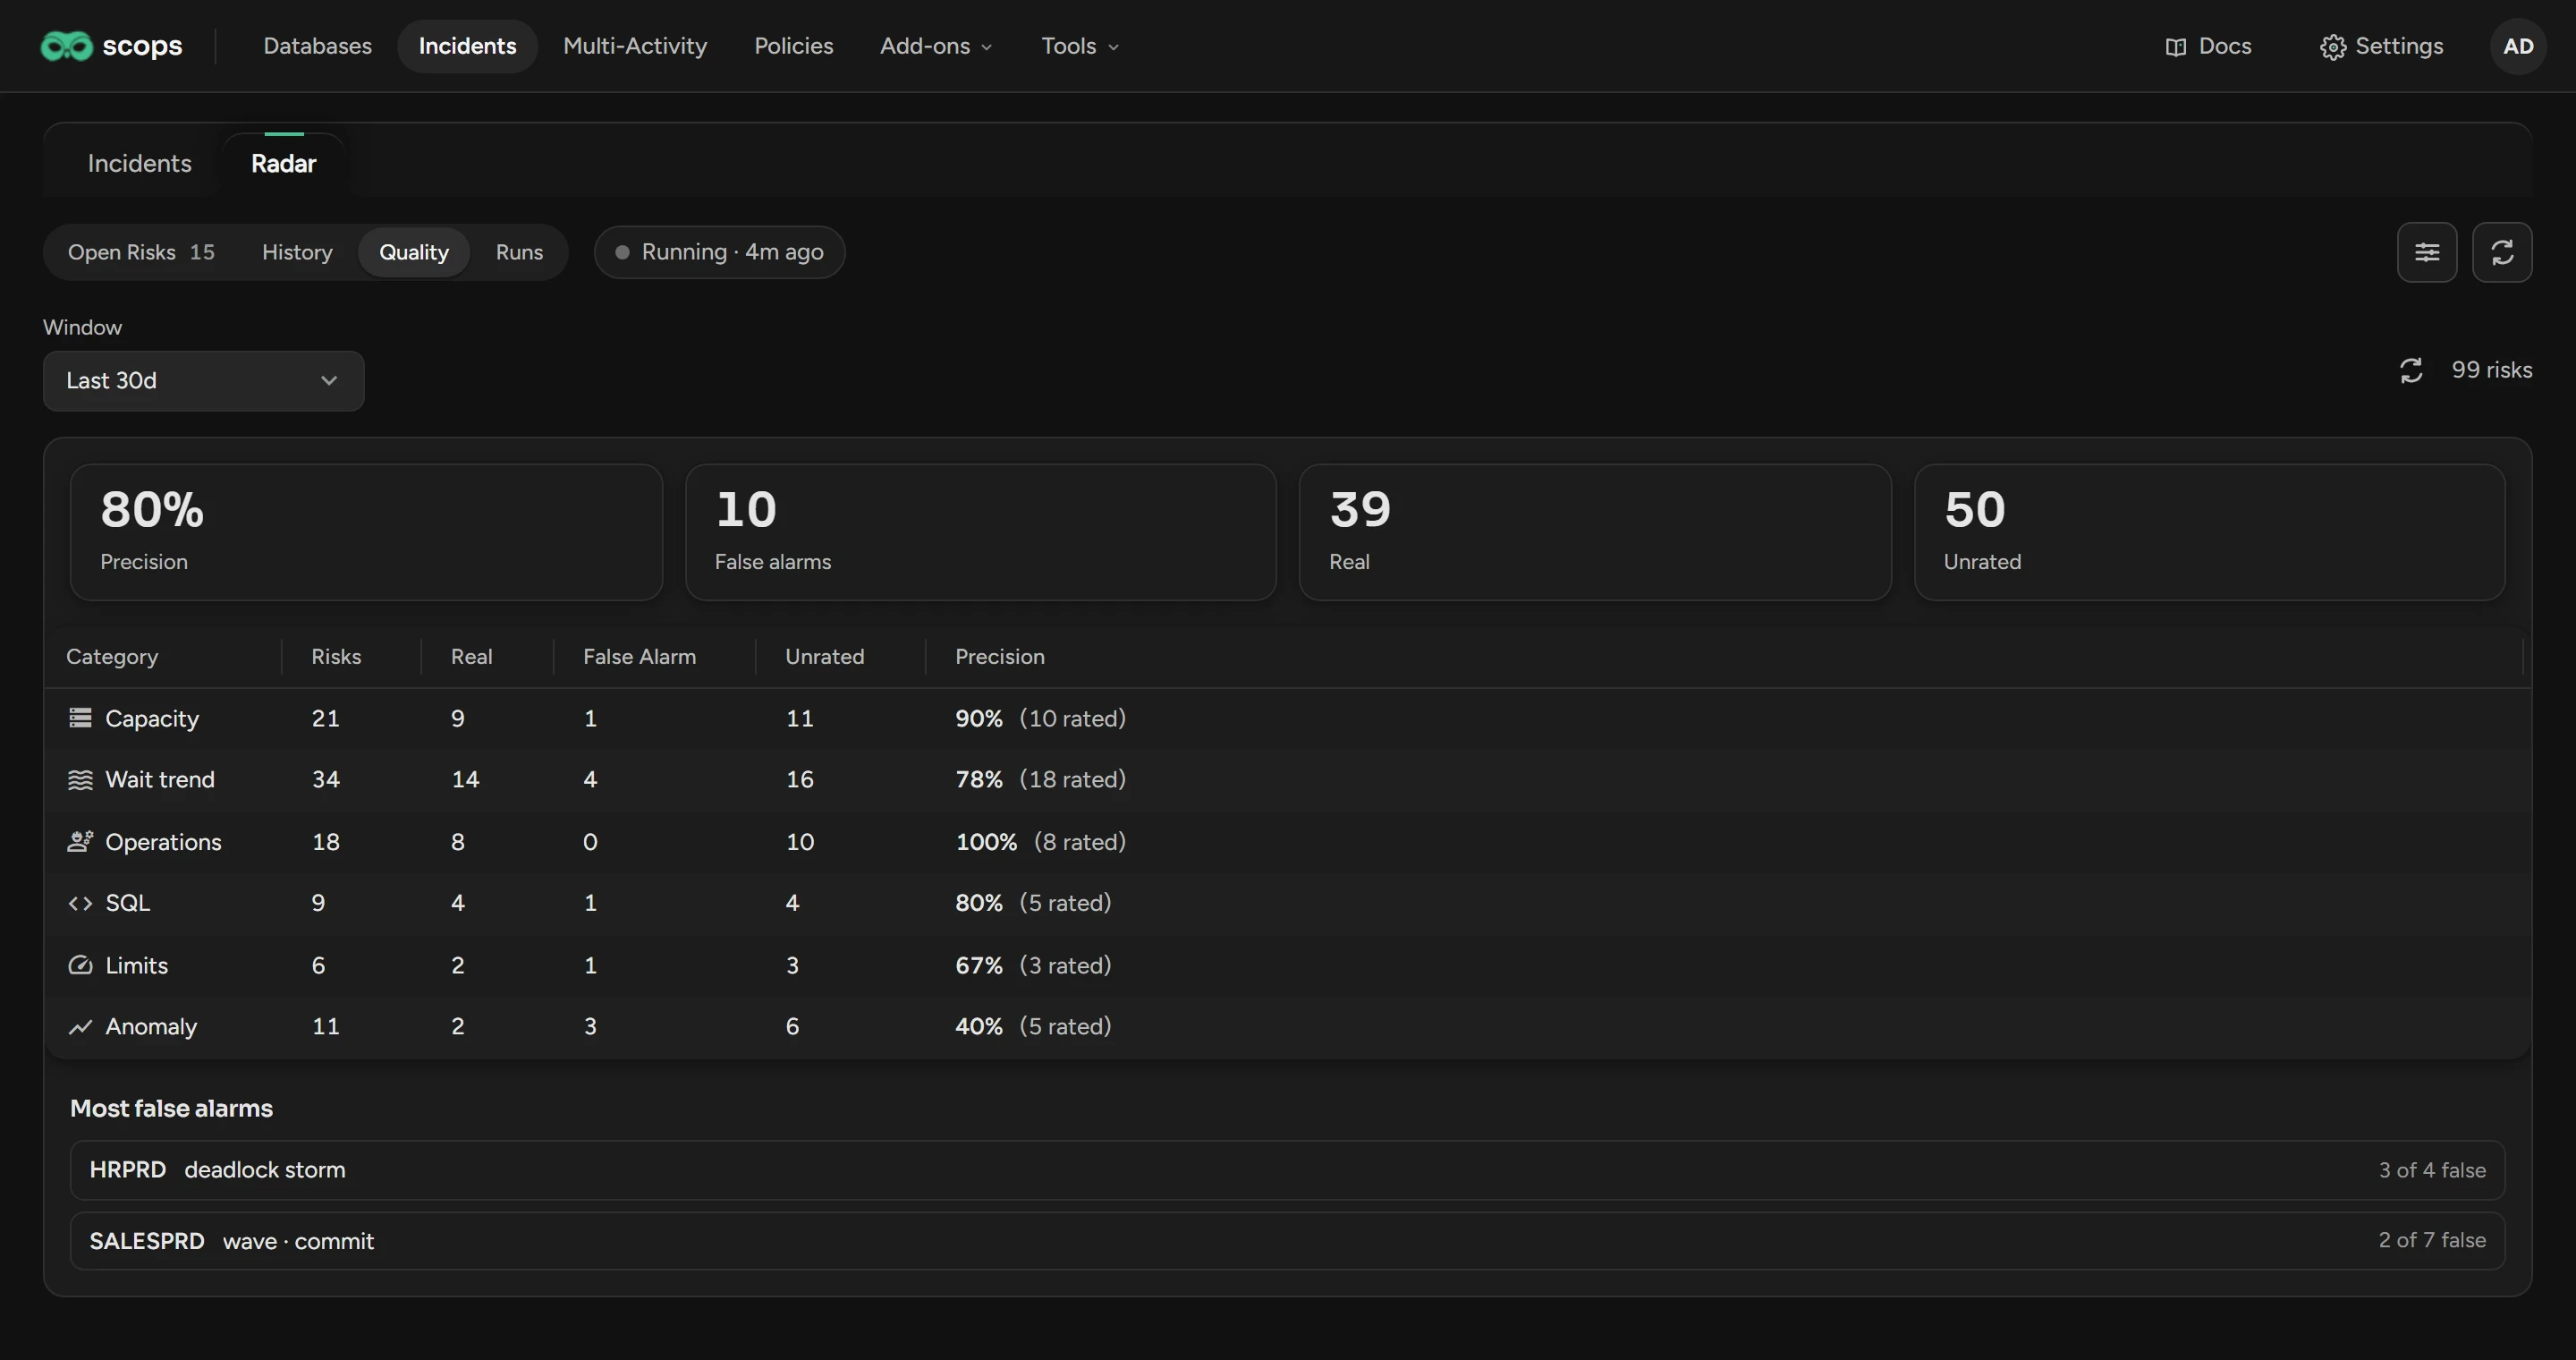
If a category has low precision, try a higher threshold, a mute or an exclusion.
Find findings on other pages
These places show findings and open the same dialog:
- The Dashboard, and the marks on its Activity chart.
- Incidents, the Databases page and Multi-Activity.
- Metrics, Memory and Health Check.
Radar can also send findings by e-mail.
Related
Updated November 6, 2026