Exadata
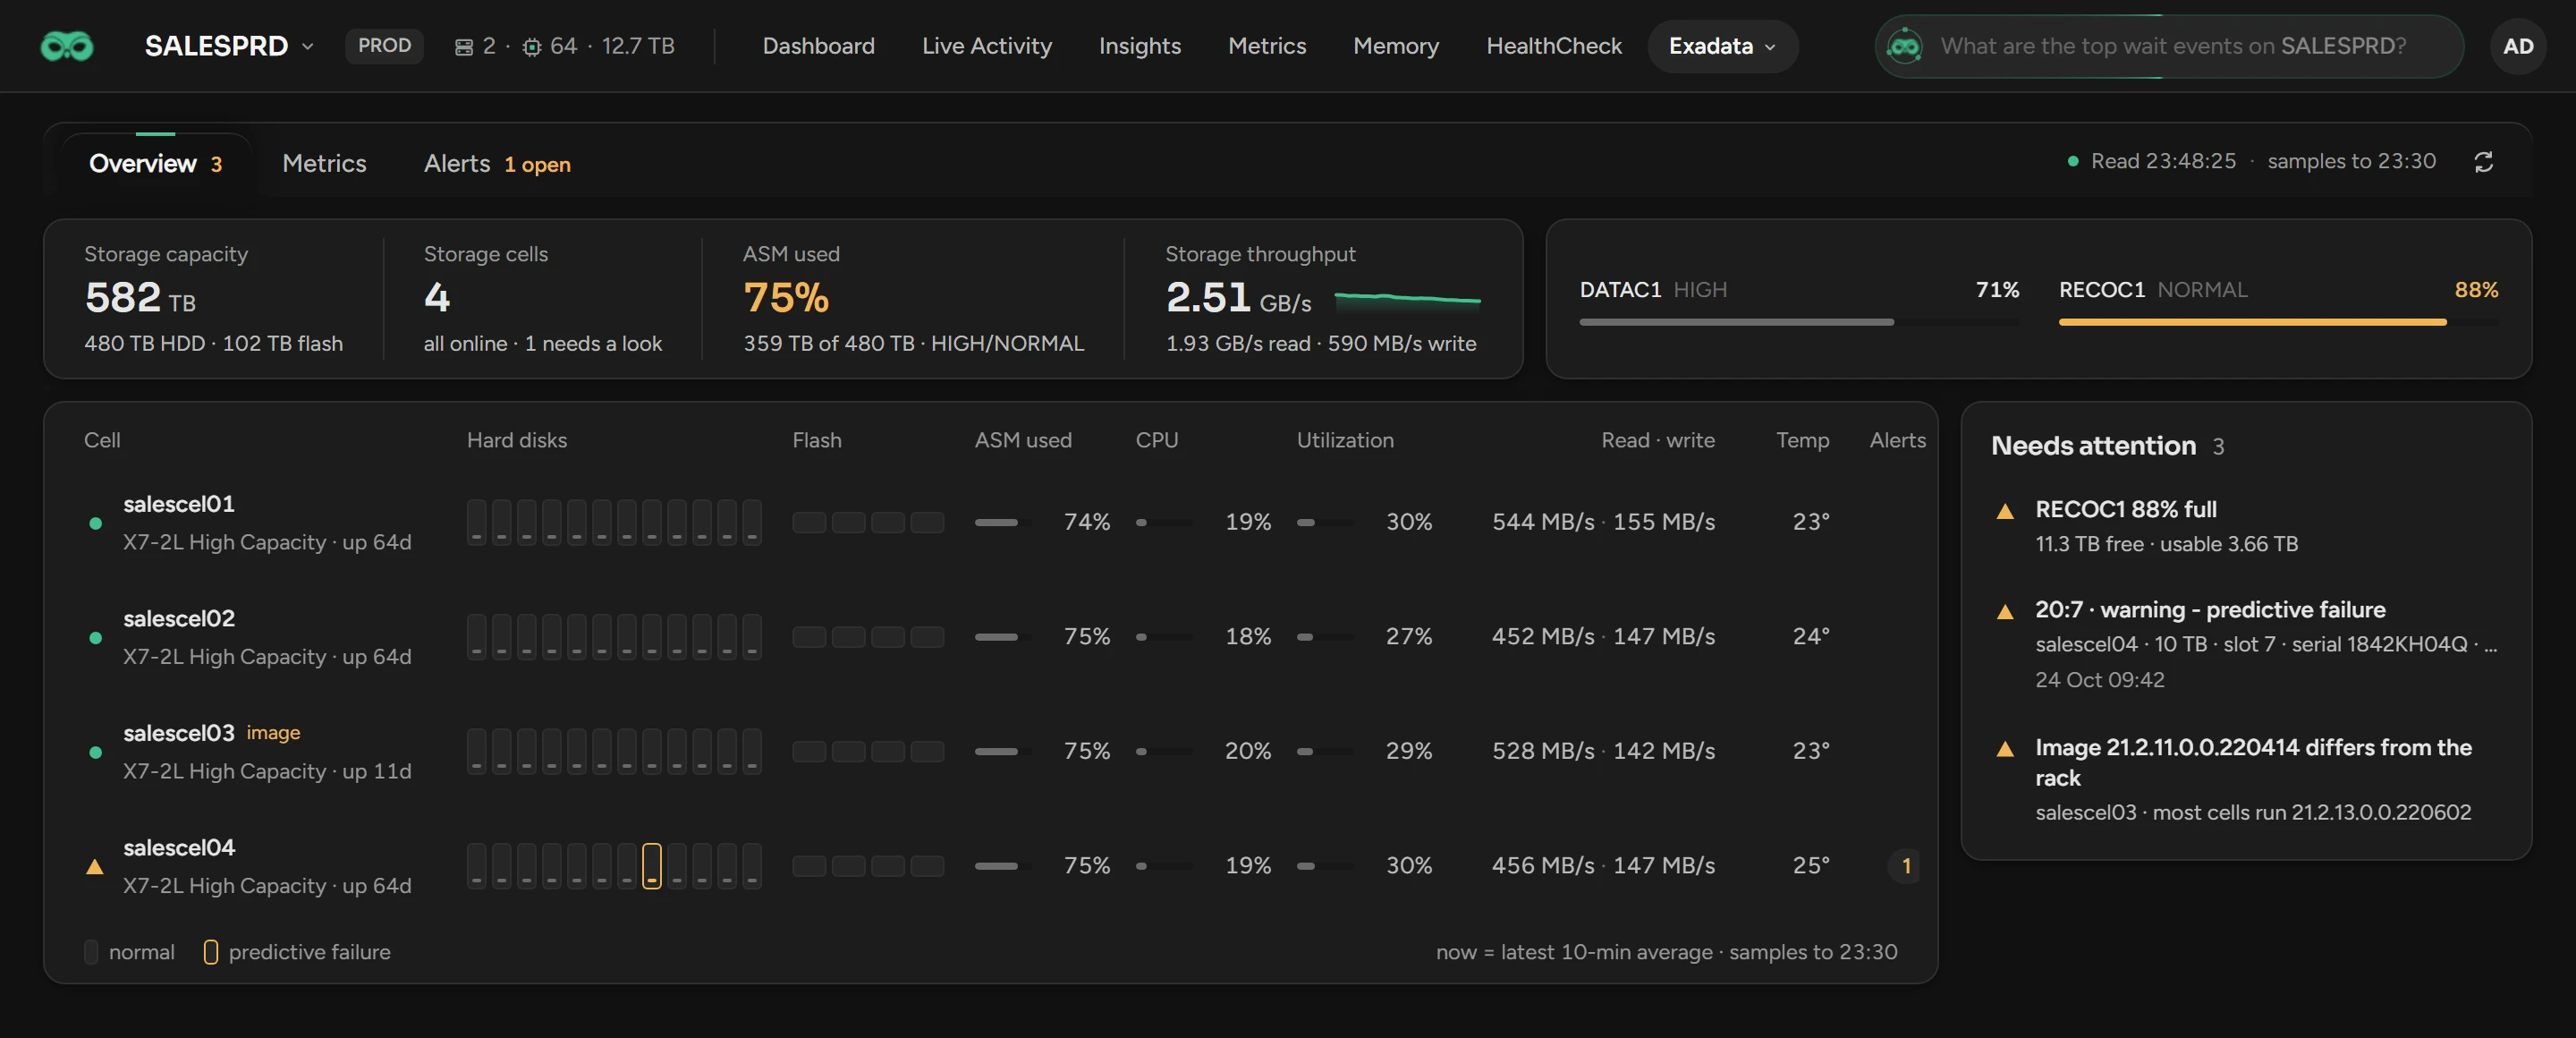
Use Exadata to check the storage cells under one database: capacity, disks and flash cards, load, temperature and alerts.
Before you begin
- You need the View Exadata permission. The Exadata tab shows only on a database that runs on Exadata.
- Scops reads the cells through the database, with no login to the cells. The monitoring account needs grants on the cell views (see Privileges).
- Scops keeps the cell metrics for 31 days by default, 15 days in the Community edition.
"Could not read the Exadata data — this is not an all-clear" means that Scops could not read the cells. Click Retry.
Check the capacity
| Value | What it shows |
|---|---|
| Storage capacity | The raw size of all hard disks and flash cards. |
| Storage cells | The number of cells. Red when a cell is offline or the database cannot reach it. |
| ASM used | The raw space in all disk groups, with mirror copies. |
| Storage throughput | The reads and writes of all cells per second. |
Each ASM disk group has a gauge: amber from 80% full, red from 90%. usable is the space that files can still use, after mirroring and the space kept to recover from a disk failure.
Check the cells
Each storage cell is one row. Click a row to open the cell: its Disks by slot, the ASM space on this cell, the Environment and the Cell data. Show Its Alerts lists its open alerts.
| Column | What it shows |
|---|---|
| Cell | The name, model and uptime. A flag such as image marks a different software image or flash cache mode. |
| Hard disks, Flash | One slot for each disk: a line in the accent color for a normal disk, amber for a predictive failure or a warning, red for a failed or missing disk. |
| CPU, Utilization | The latest 10-minute average: amber from 75%, red from 90%. |
| Temp | The ambient temperature: amber from 28 °C, red from 35 °C. A power supply, fan or battery that is not normal also shows here. |
| Alerts | The open alerts of the cell. Click the number to see them. |
Find what needs attention
The Needs attention card lists each amber or red item of the cells and disk groups, and each open alert, the worst first. Click a line to open its cell or its alerts.
It also shows:
- an address in cellip.ora without a cell;
- a disk group with offline disks, or not mounted;
- a cell that restarted in the last 24 hours;
- a cell with no metric samples for 4 hours.
Read the cell metrics
Click the Metrics tab. The four charts show CPU usage, Utilization, Read Bytes per second and Write Bytes per second.
To change a metric, select it in the title of the chart. For one line per cell, turn on Per Cell.
Select the window: Live (4 hours, the default), 1D, 1W, 1M, or up to 31 days with the calendar button.
Oracle names the throughput metrics "Bytes per second", but their values are MB per second. The chart shows the unit.
Read the cell alerts
The Alerts tab lists the alerts of the cells in the last 30 days, the open ones first. Filter them with All, Critical, Warning and Info. Click an alert to see its full message.
Related
Updated November 2, 2026