Multi-Activity
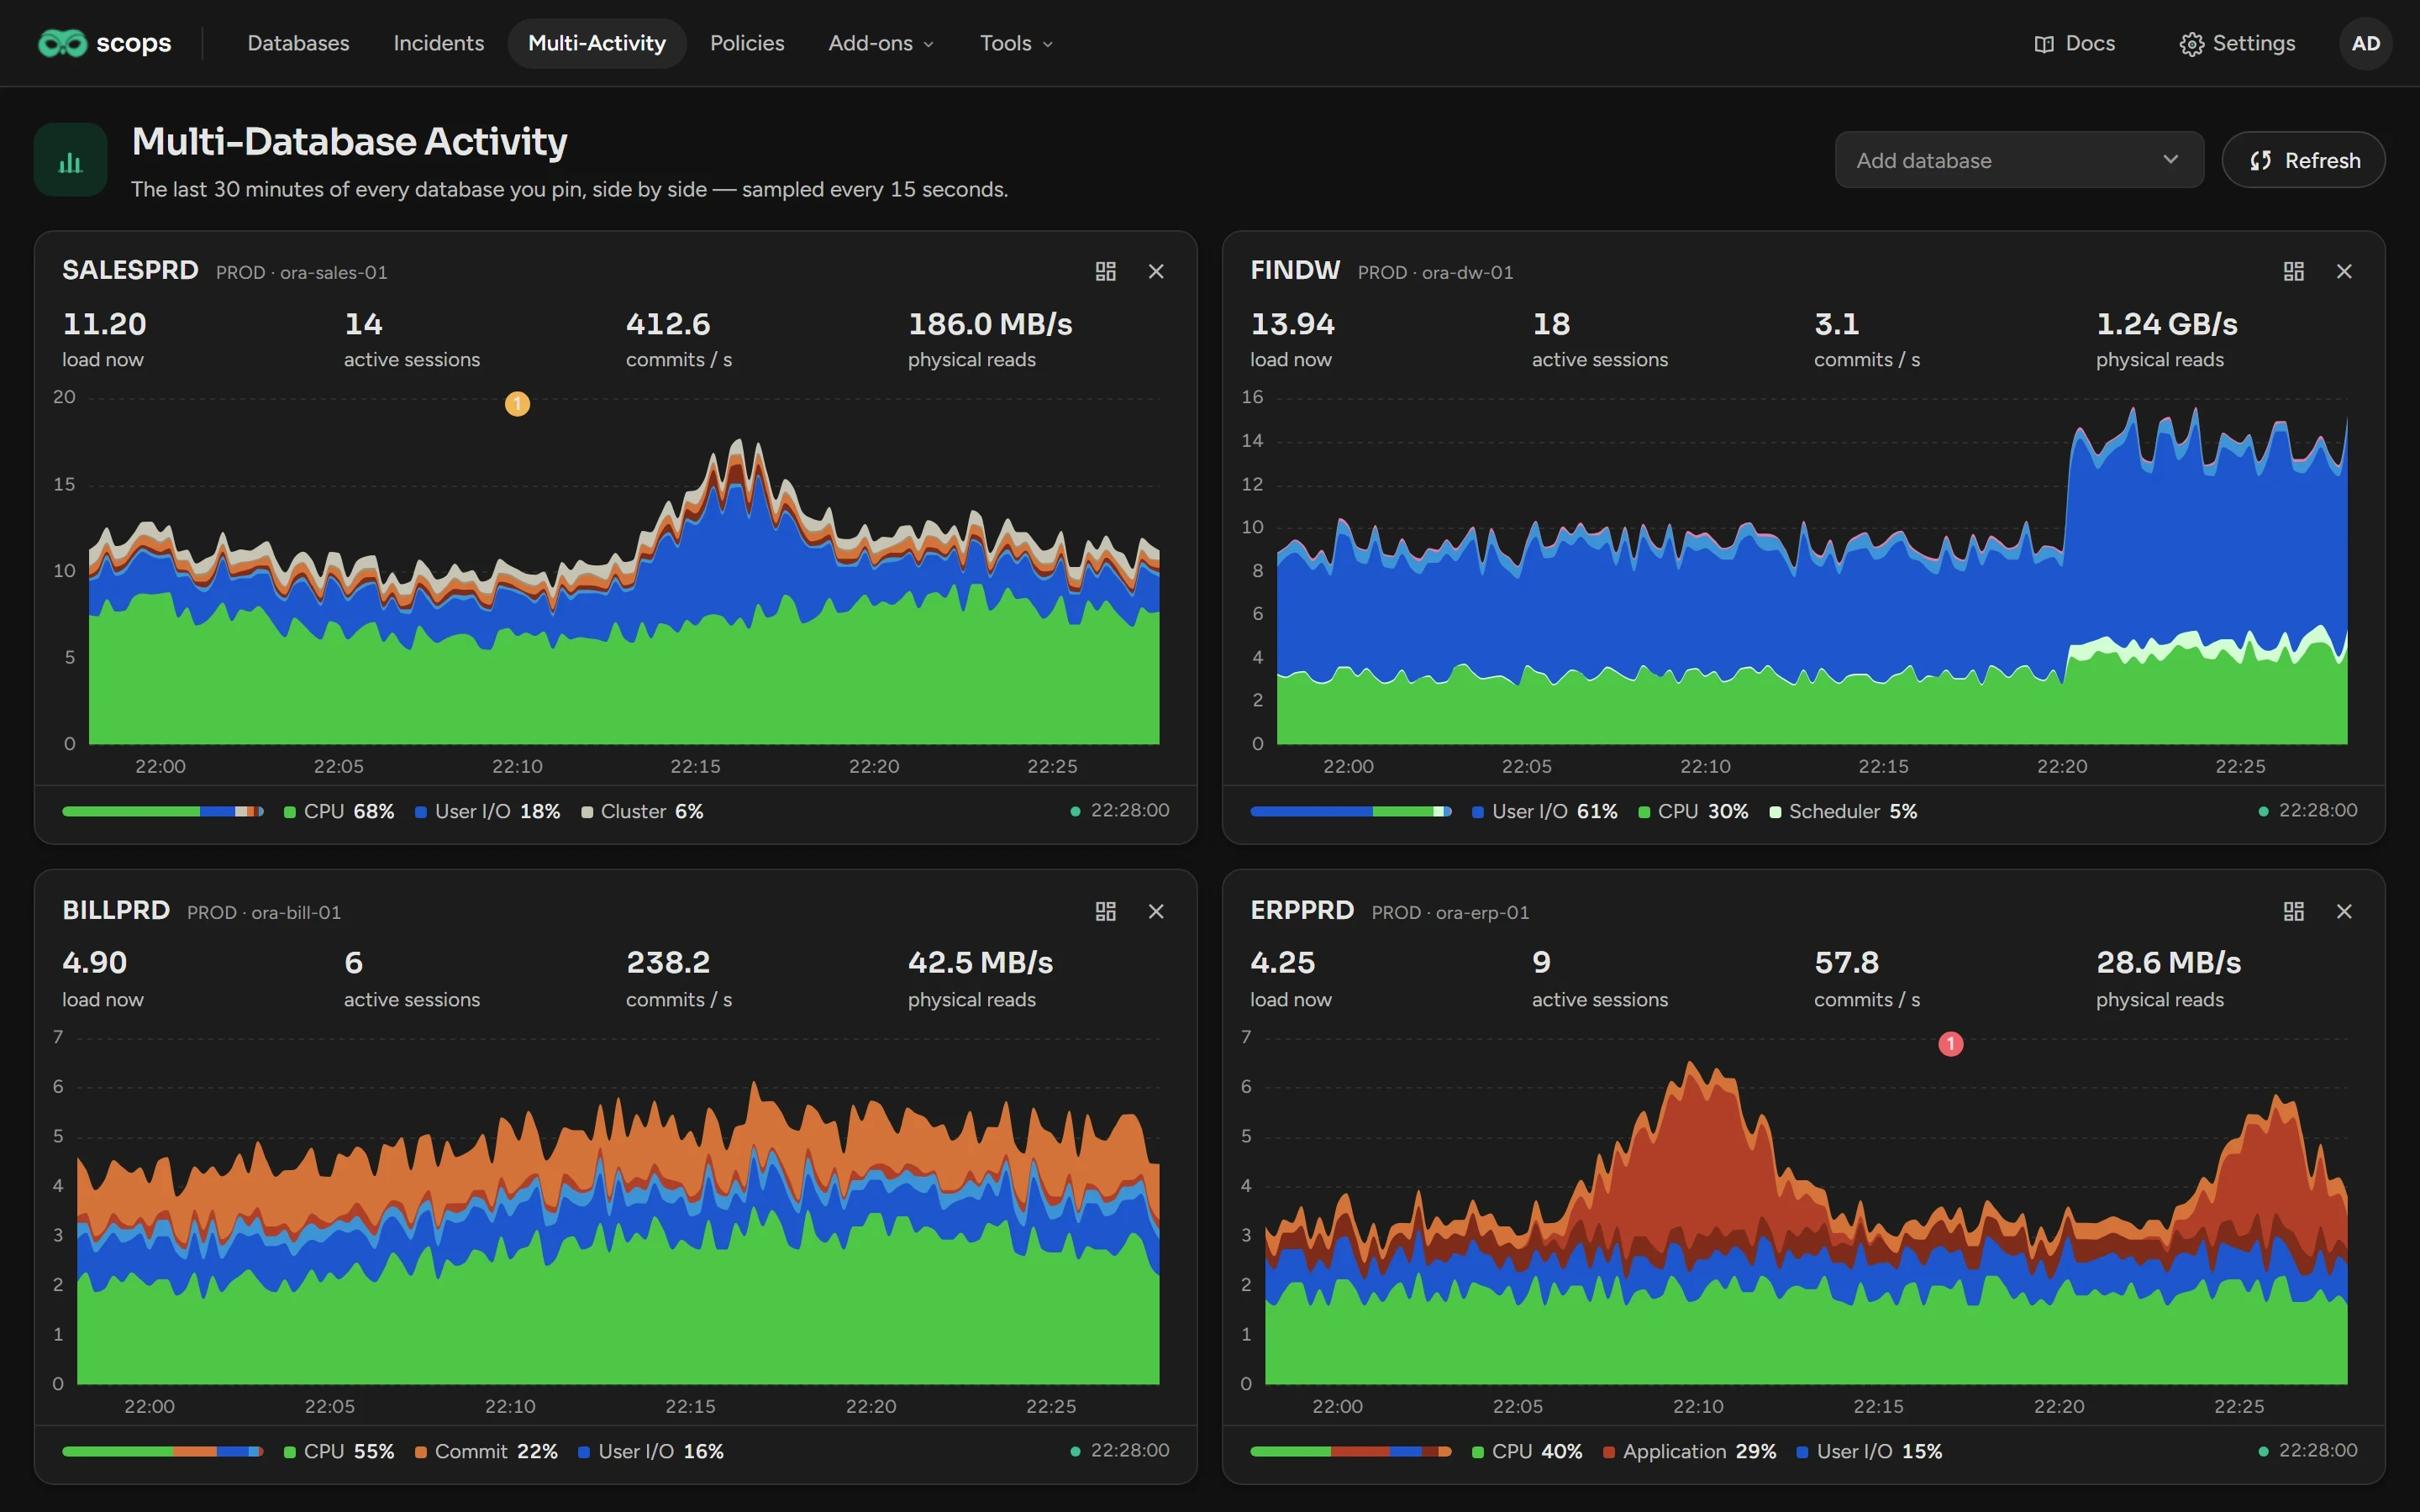
Pin up to six databases to see their last 30 minutes of activity next to each other.
Before you begin
- You need View Multi-Activity. A user limited to one group can pin only the databases of that group.
- The page uses the session samples that Scops already has. It adds almost no load and needs no Oracle Diagnostics Pack.
Pin databases
Open Multi-Activity in the top bar.
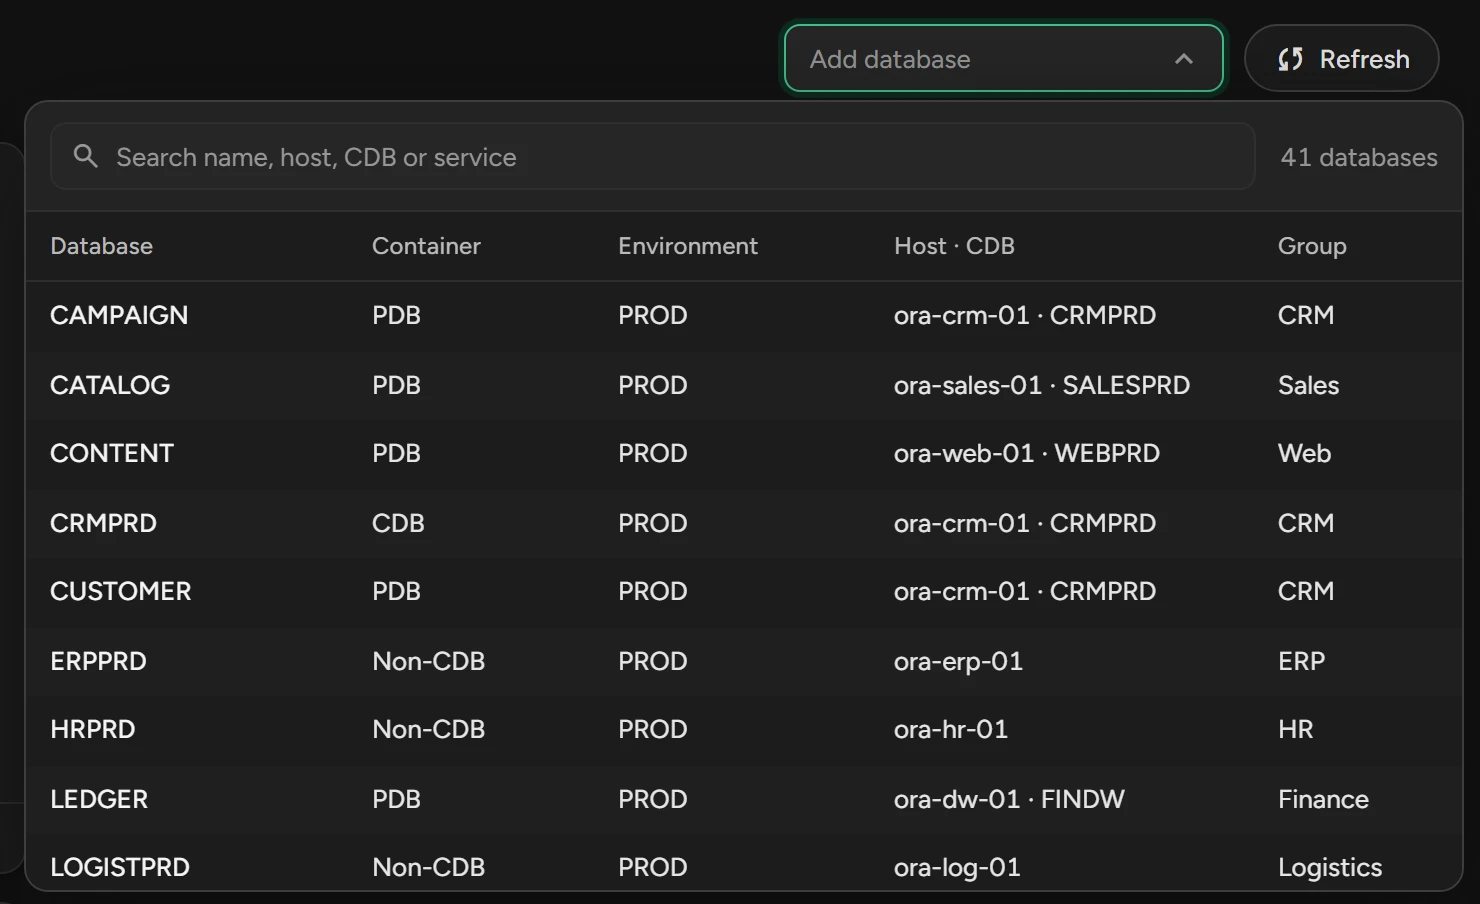
Click Add database and type part of the name, host or service.
Click the database. Its card shows the last 30 minutes.
Offline databases are not in the list. Scops keeps your cards in this browser. To remove a card, click its ×.
Refresh
Each card reads its newest samples every 15 seconds. Refresh reads all cards now.
If a read fails, the card keeps its last chart and says so in its foot. A card without data shows the cause, with Retry if a read failed.
What you see
| Figure | What it is |
|---|---|
| load now | The active sessions on average in the newest minute. Compare it with the CPU count. |
| active sessions | The active sessions in the latest sample. |
| commits / s | User commits each second, in the latest minute. |
| physical reads | Bytes read from disk each second, in the latest minute. |
The chart shows the active sessions by wait class in 15-second steps, on the clock of the database. The foot shows the share of each wait class in the last 5 minutes. The dashboard button opens the Dashboard.
Radar alarms on the chart
A numbered mark above the chart shows a Radar finding of the last 30 minutes, in the color of its severity. Point to the mark to see the findings, or click it to open the worst one.
Related
Updated October 29, 2026