Summary
See all your databases in numbers, and open the list of databases behind each number.
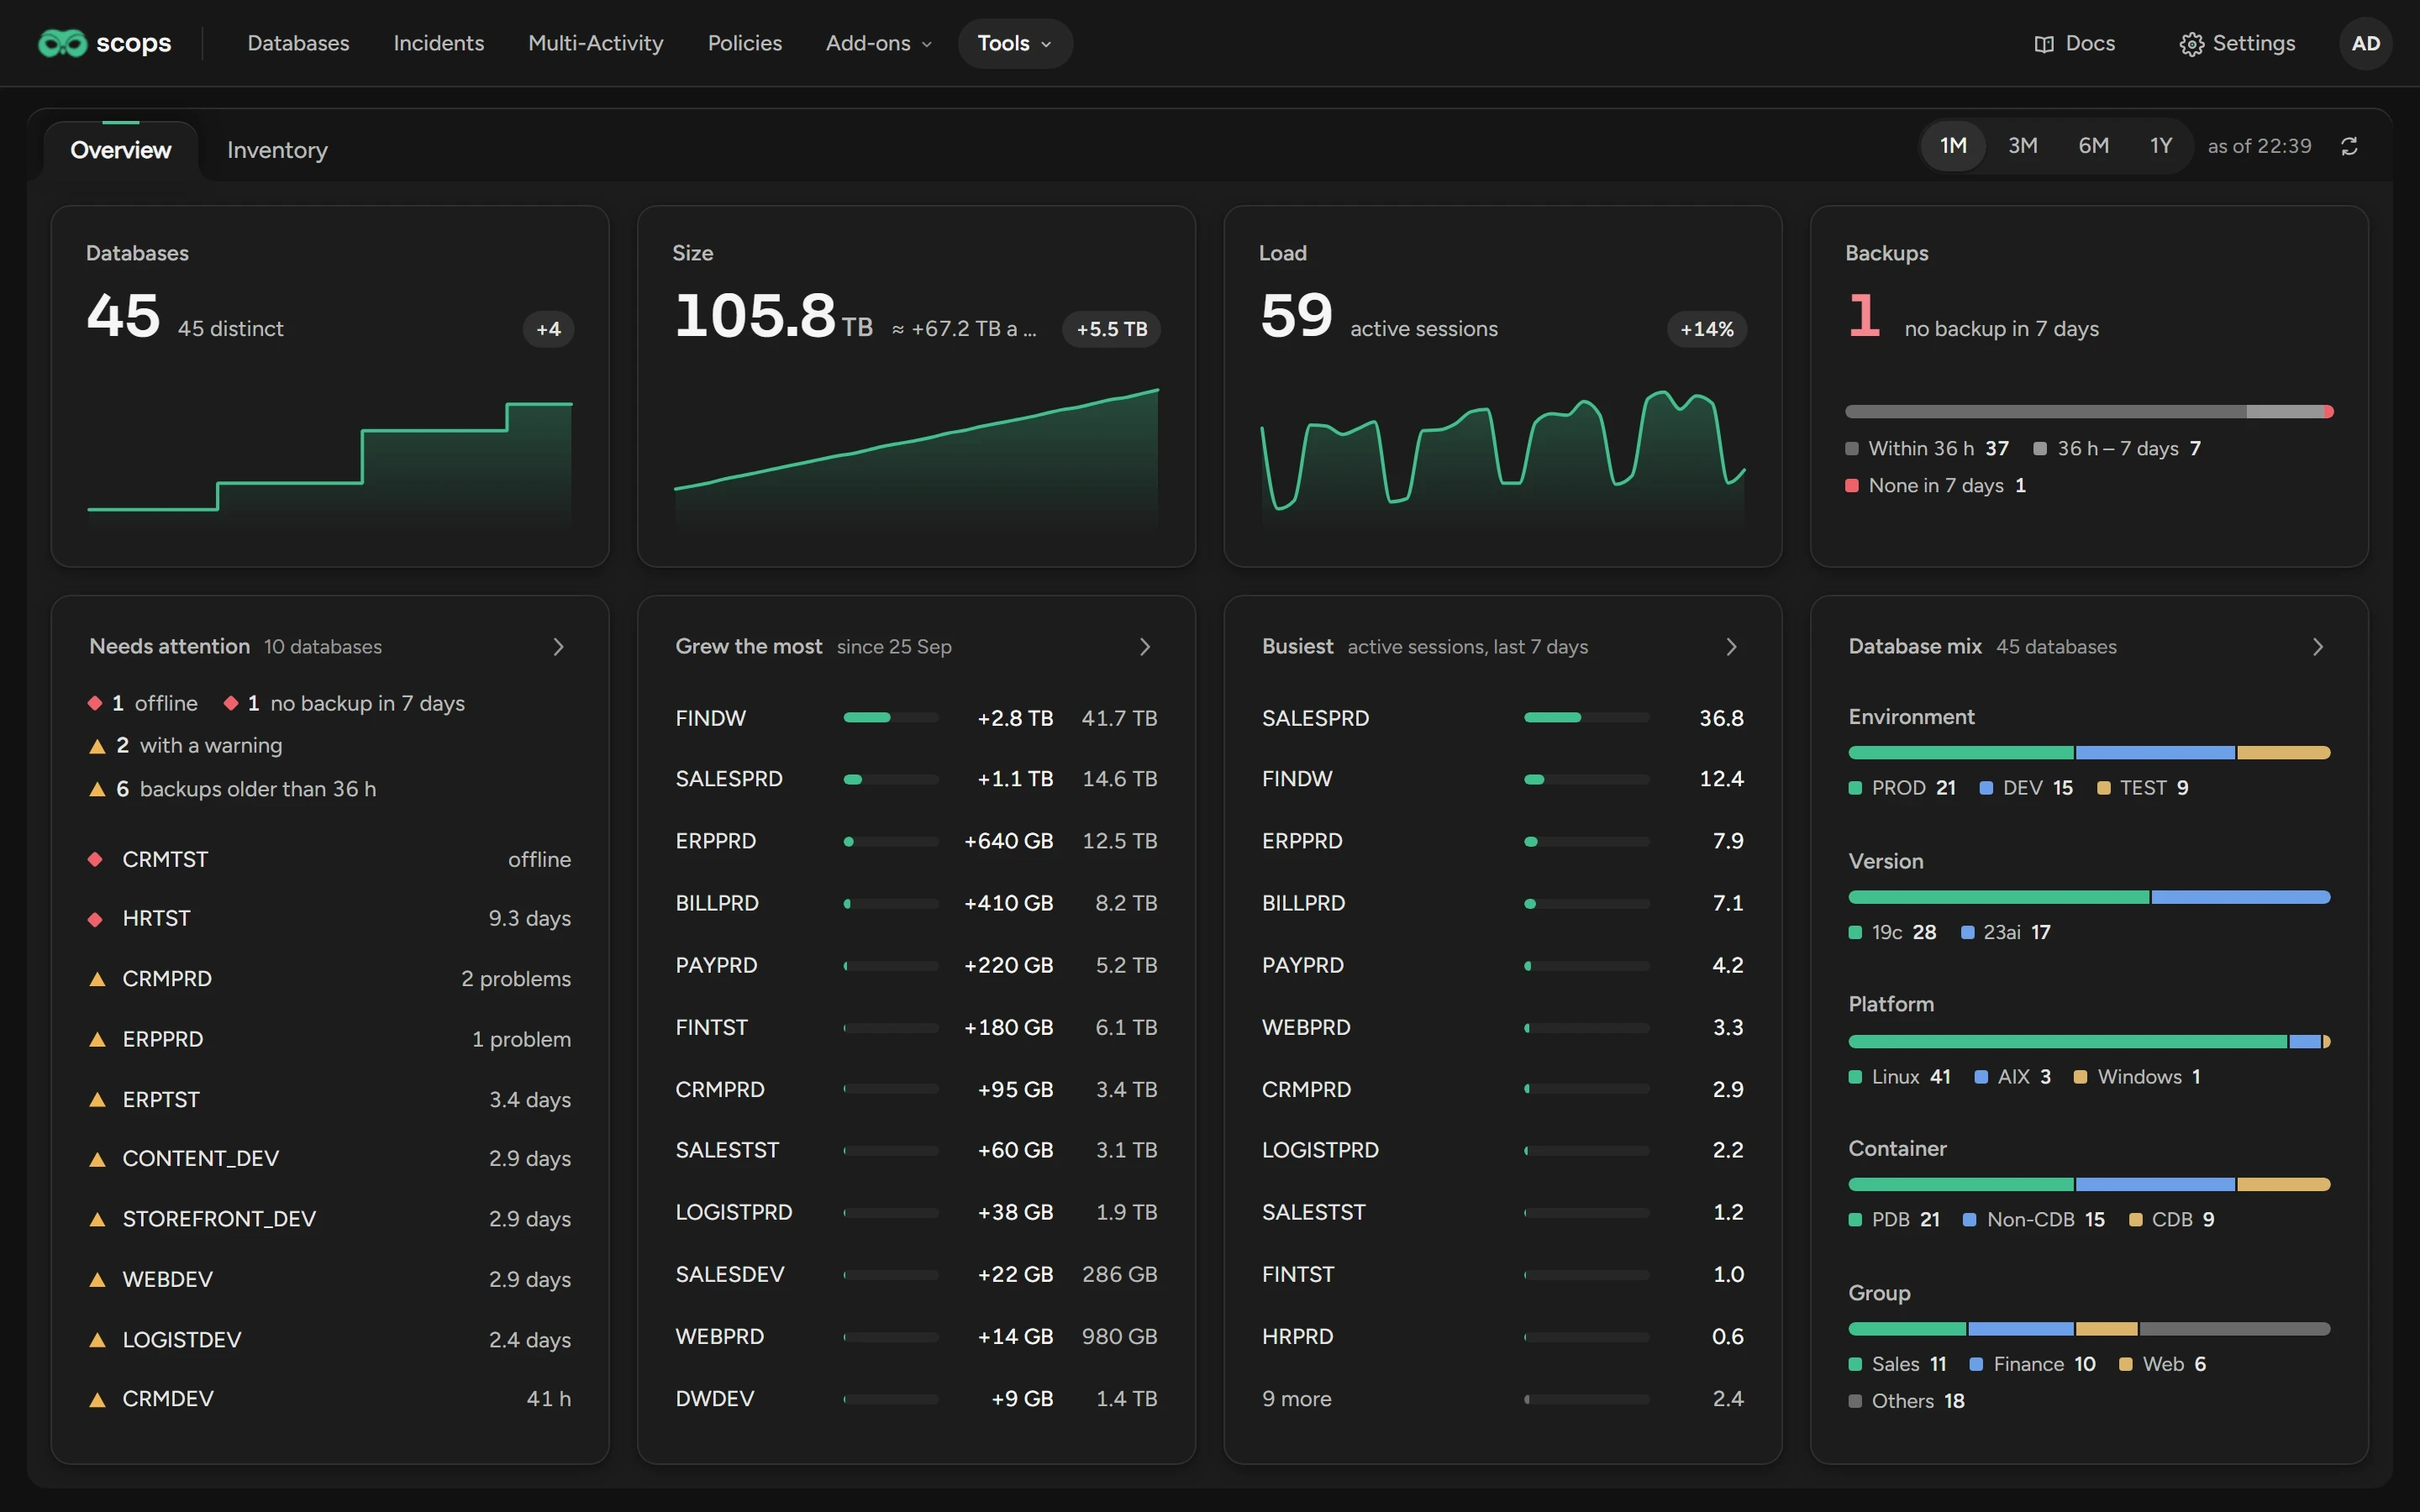
Before you begin
- Open Tools › Summary. You need View Summary.
- Summary uses the data that Scops already has, mostly the daily inventory, so it adds no load to your databases. A new database shows completely after its first inventory.
- The figures can be 15 minutes old. The refresh button builds them again.
Set the period
Click 1M (default), 3M, 6M or 1Y at the top right. The period sets the vitals and Grew the most.
Open the list behind a number
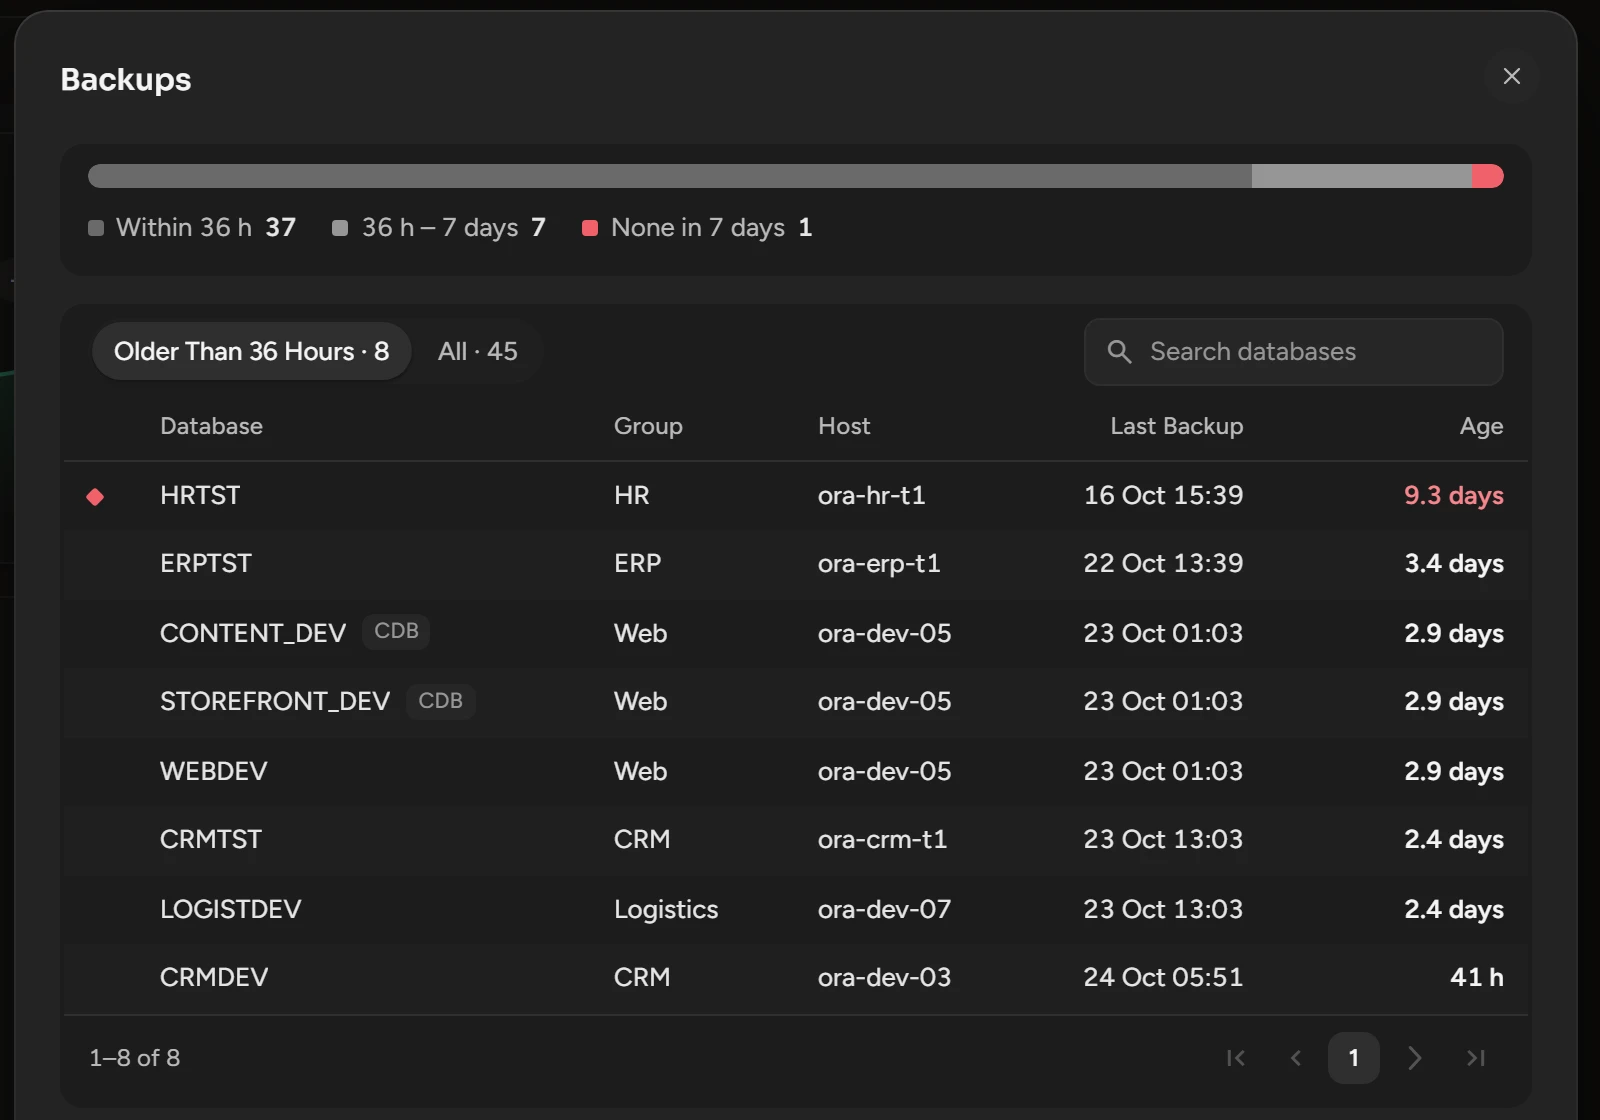
Click a vital, a card, a row or a figure. Its list opens in a panel.
Click a database in the list to open its Dashboard.
In the Size panel, Projection shows the next period as a dashed line. It needs Scops AI.
Overview
| Vital | What it shows |
|---|---|
| Databases | The registered databases, and the distinct ones: a RAC database registered node by node counts one time. |
| Size | The allocated size of all databases, and its growth as a yearly rate. |
| Load | The active sessions of all databases on the last day. Amber when the last 3 days are 25% above the first 3 days of the period. |
| Backups | The primary databases with no full or incremental backup in 7 days (red), or a backup older than 36 hours (amber). |
| Card | What it shows |
|---|---|
| Needs attention | Databases that are offline, with no backup in 7 days, with a warning, or with a backup older than 36 h. |
| Grew the most | The most growth in the period. |
| Busiest | The most active sessions in the last 7 days. |
| Database mix | The databases by environment, version, platform and container. |
A bar is the true share of the total. A database with 5% of the growth has a short bar, also at the top of the list.
Inventory
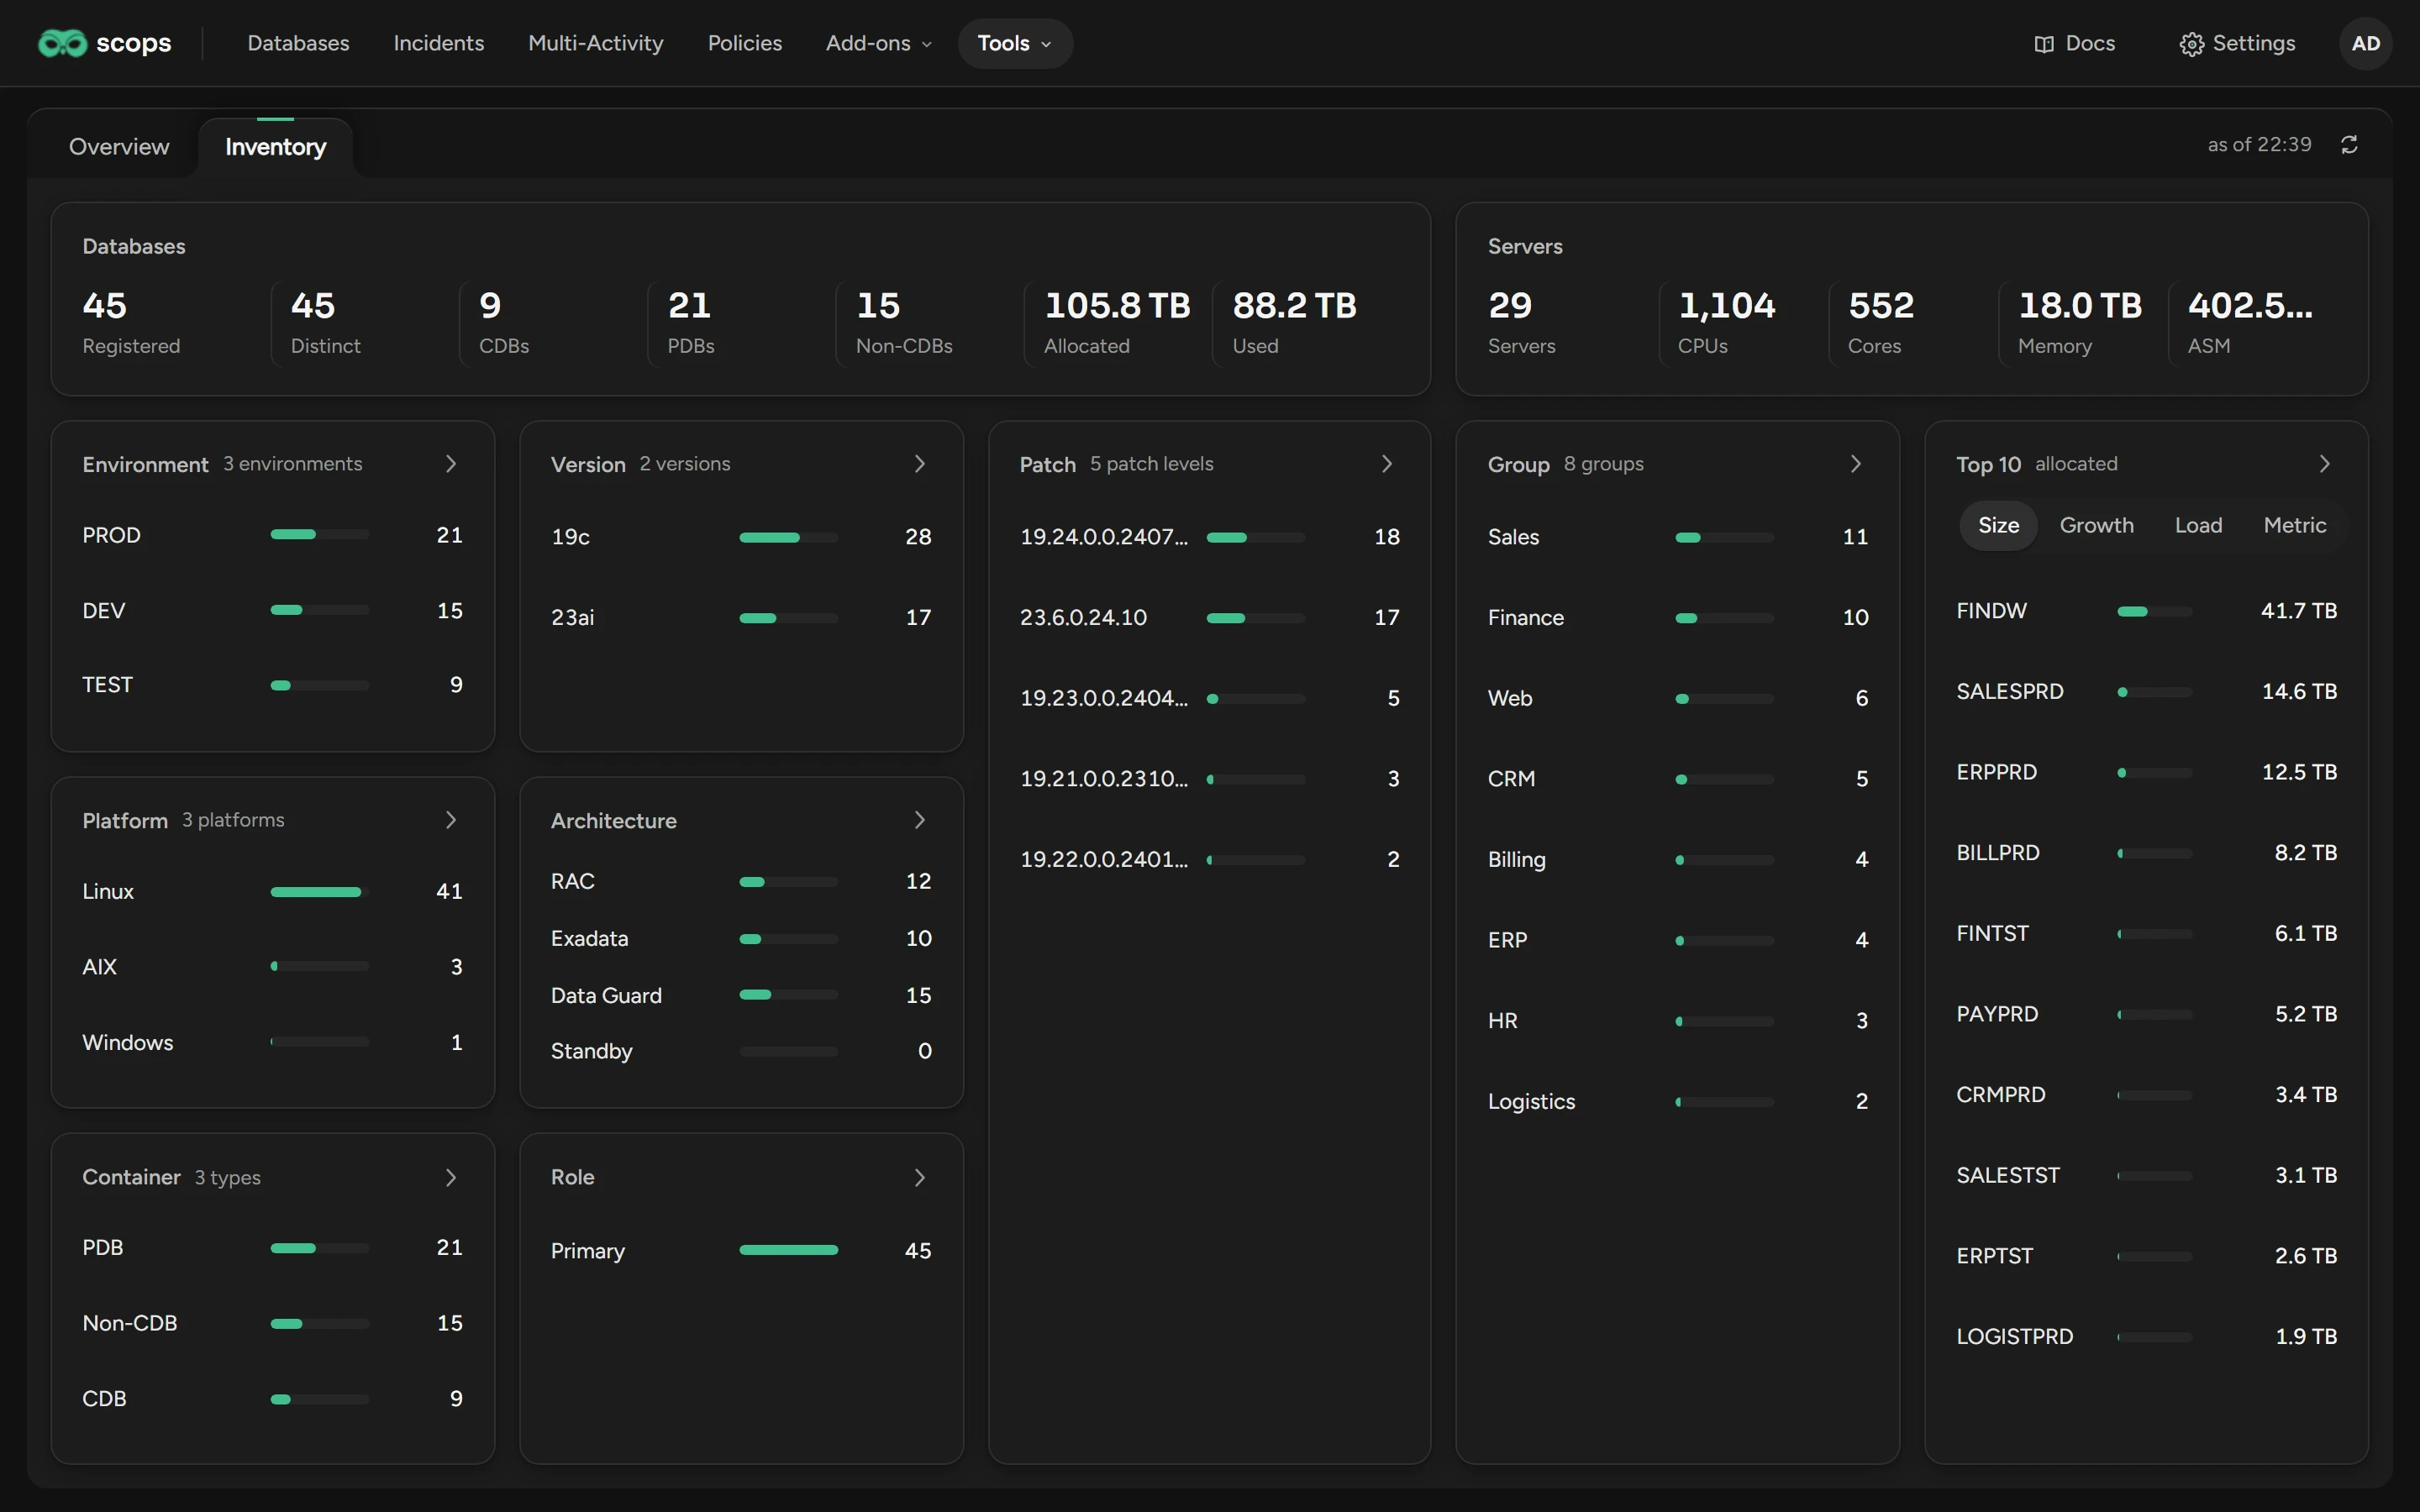
| Card | What it shows |
|---|---|
| Databases | The CDBs, PDBs and non-CDBs, and the allocated and used size. |
| Servers | The servers of the last 7 days, with CPUs, cores, memory and ASM storage. |
| Environment, Version, Patch, Platform, Group | The number of databases for each value. |
| Architecture | The databases on RAC, Exadata or Data Guard, and the standbys. |
| Top 10 | The ten largest, the most growth, the busiest, or the highest for a metric. |
Related
DatabasesThe status of each database.
Weekly performance reportA week of each database in a mail.
LicenseThe Oracle options and packs in use.
Updated October 29, 2026