Memory
Use Memory to see how the SGA and PGA of one database are sized and used, and which memory issue needs attention.
Before you begin
- You need the View Memory permission. The monitoring account needs the required grants.
- Scops keeps the memory history for 32 days and the SGA resize log for 90 days, 15 days in the Community edition.
Choose the window and the instance
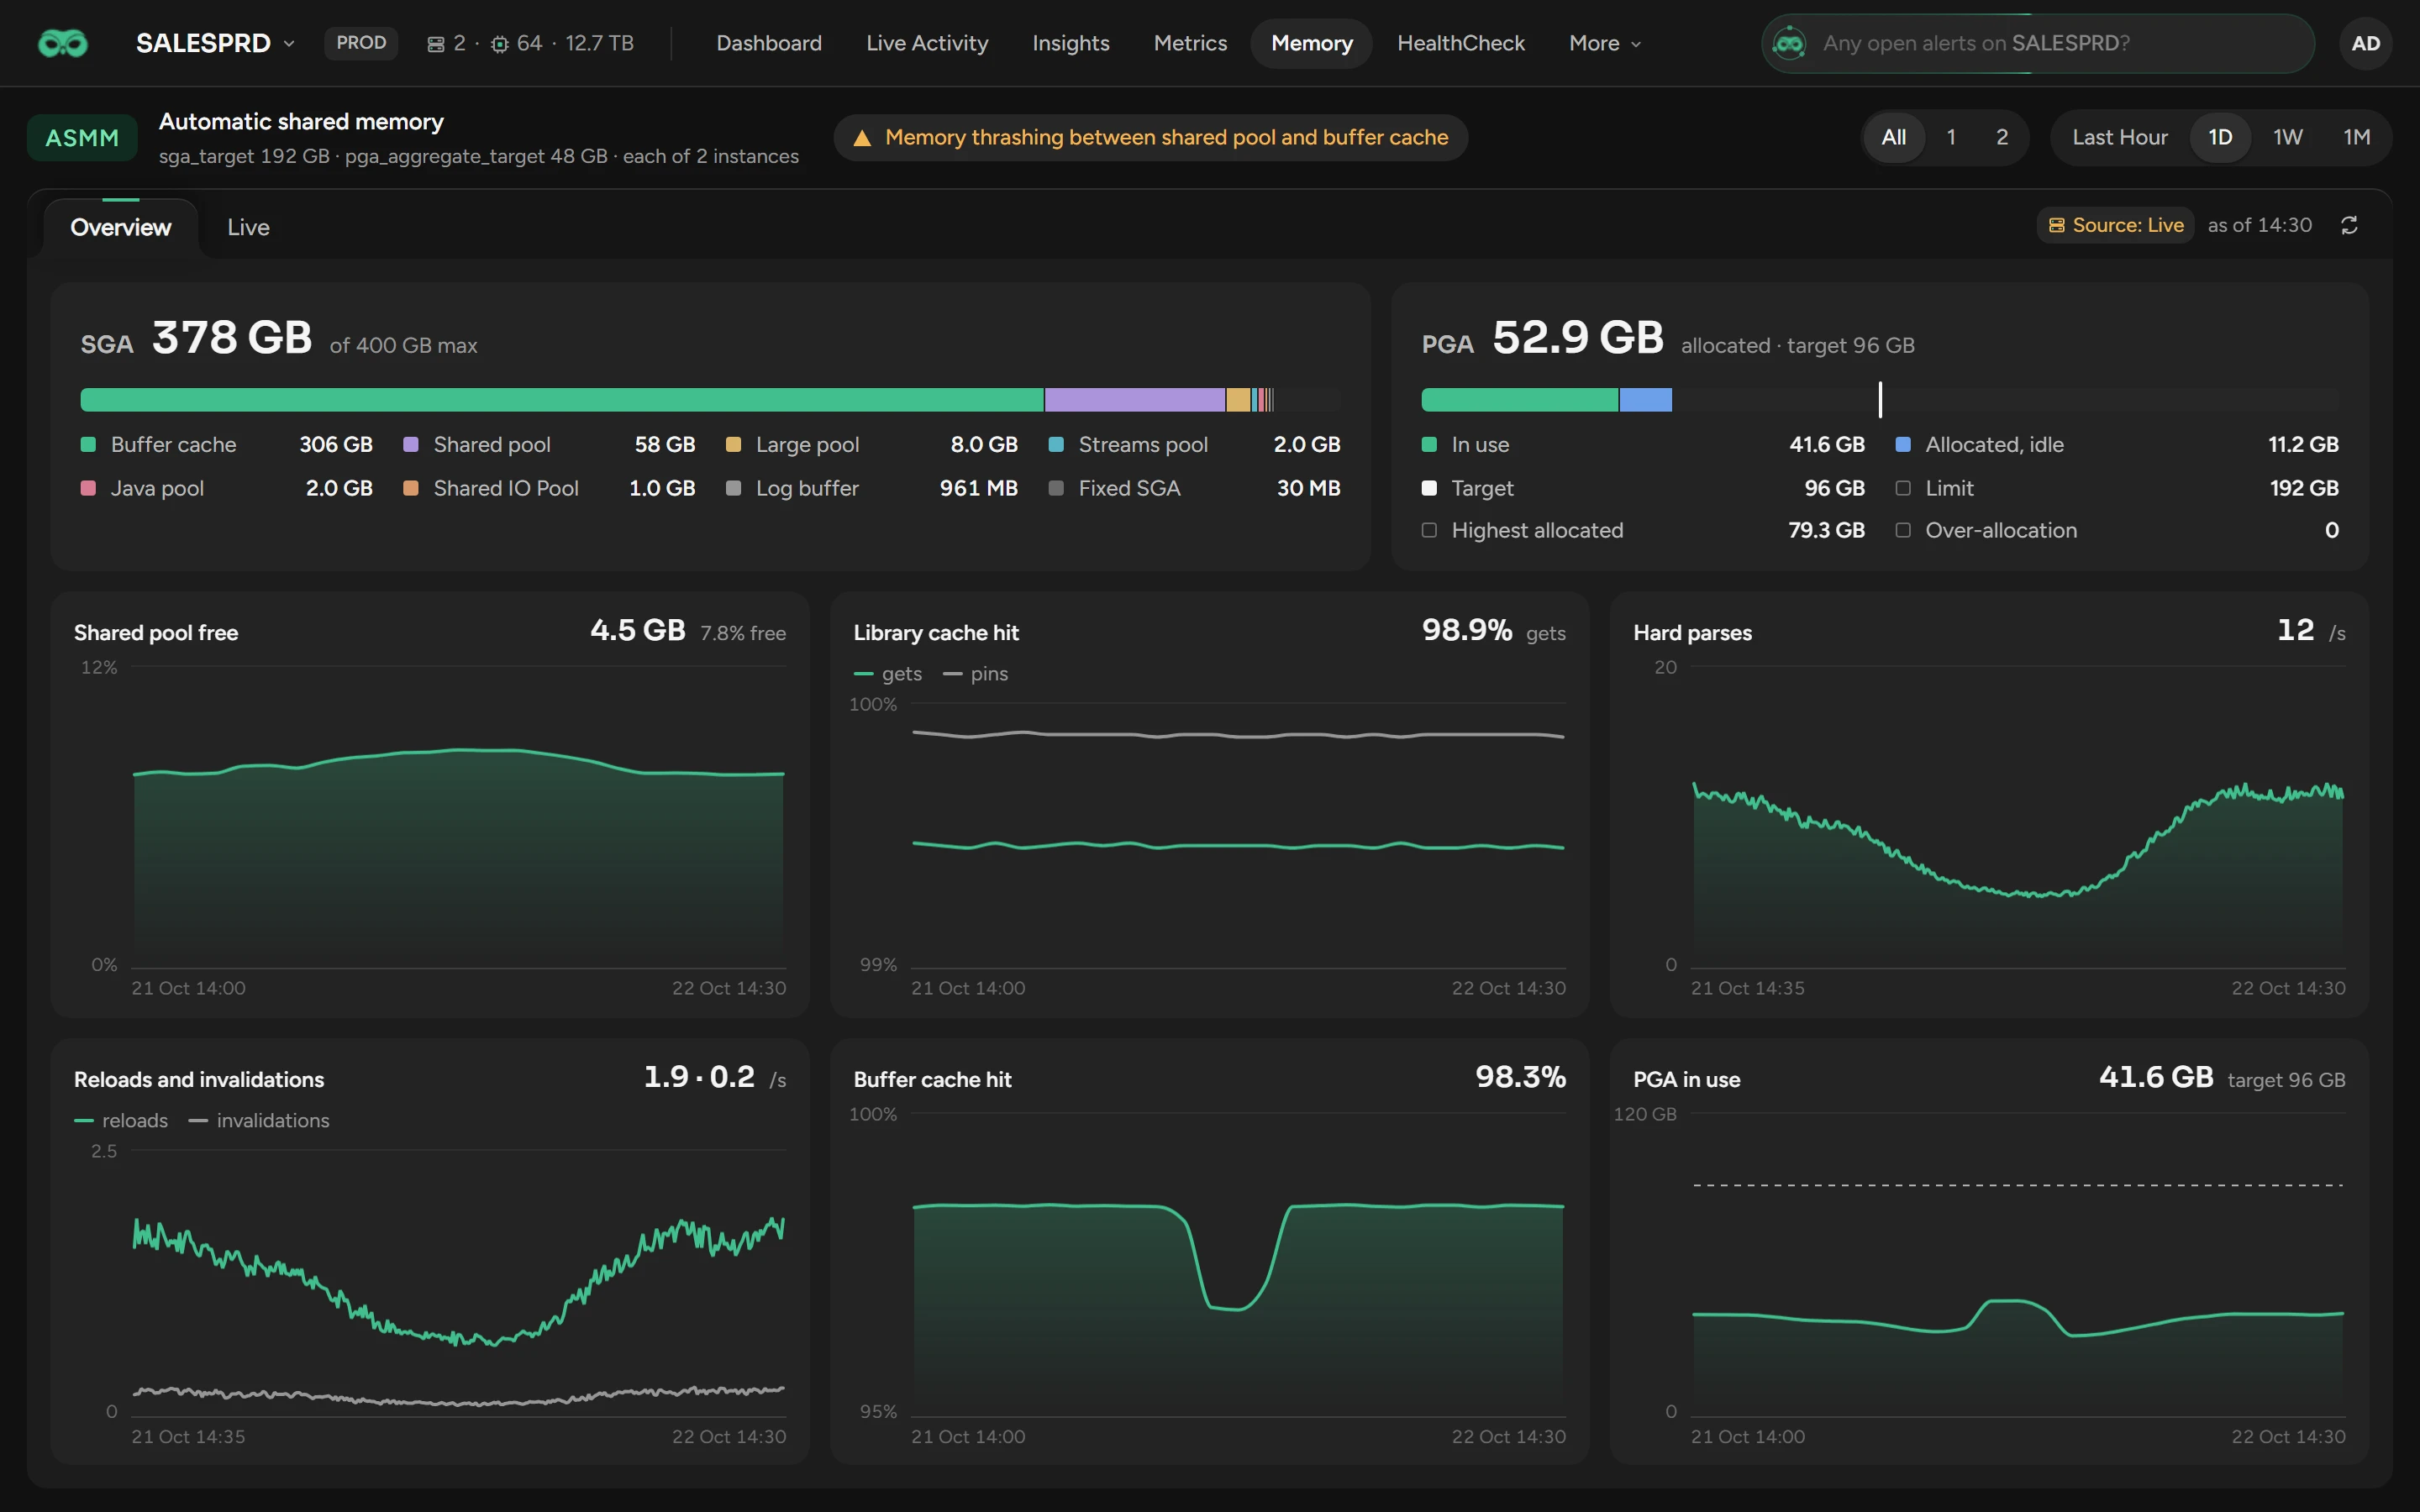
In the top line, click Last Hour, 1D, 1W or 1M. On RAC, click All to add up the instances, or a number to show one instance.
Check the memory mode and the issue
The top line shows the memory mode: AMM (memory_target set), ASMM (sga_target set) or MANUAL. PDB is a pluggable database that you added alone. Click the mode to see its parameters.
Next to it is the most serious memory issue: red when critical, else amber. +2 means that there are more. Hover over the issue for the advice, or click it to open its panel.
What the issues mean
| Issue | When |
|---|---|
| ORA-04031 or ORA-04030 in the alert log | In the last 7 days. Critical. |
| Reserved pool allocation failures | A request in the reserved area of the shared pool failed. Critical. |
| PGA close to pga_aggregate_limit | 75% of the limit. Critical at 90%. |
| PGA target over-allocated | The PGA went above pga_aggregate_target. |
| Multi-pass work areas, One-pass spills | A work area spilled to temp more than once, or 5% of the work areas spilled once. |
| Memory thrashing between shared pool and buffer cache | 6 or more grow or shrink operations. |
| Failed memory resize operations | A resize ended in an error. |
| Library cache reload pressure | Reloads reach 0.3% of pins. |
| Invalidation churn | 1,000 or more invalidations. |
| Sustained hard parsing | 10 or more hard parses a second, and 20% of all parses. |
| Shared pool free memory low | Less than 5% free. |
Scops checks the last 24 hours when the page opens, then the last hour every two minutes. The line also shows the memory findings of Radar Engine.
Read the SGA and PGA cards
- SGA: the size of each component to scale. The empty end of the bar is the space up to
sga_max_size. - PGA: In use and Allocated, idle against
pga_aggregate_limit. Over-allocation counts how many times the PGA went abovepga_aggregate_target.
Read the six charts
A chart shows a warning sign and an amber value at these levels:
| Chart | Amber when |
|---|---|
| Shared pool free | Less than 5% is free, or a critical shared pool issue is open |
| Library cache hit | Reloads reach 1% of pins, or the pin hit falls under 95% |
| Hard parses | 10 or more a second, and at least 20% of all parses |
| Reloads and invalidations | Reloads reach 1% of pins |
| Buffer cache hit | Never |
| PGA in use | 75% of pga_aggregate_limit, or a critical or warning PGA issue is open |
Open a panel
Click a chart, a row of the PGA card, or the Buffer cache or Shared pool row of the SGA card. Its panel opens.
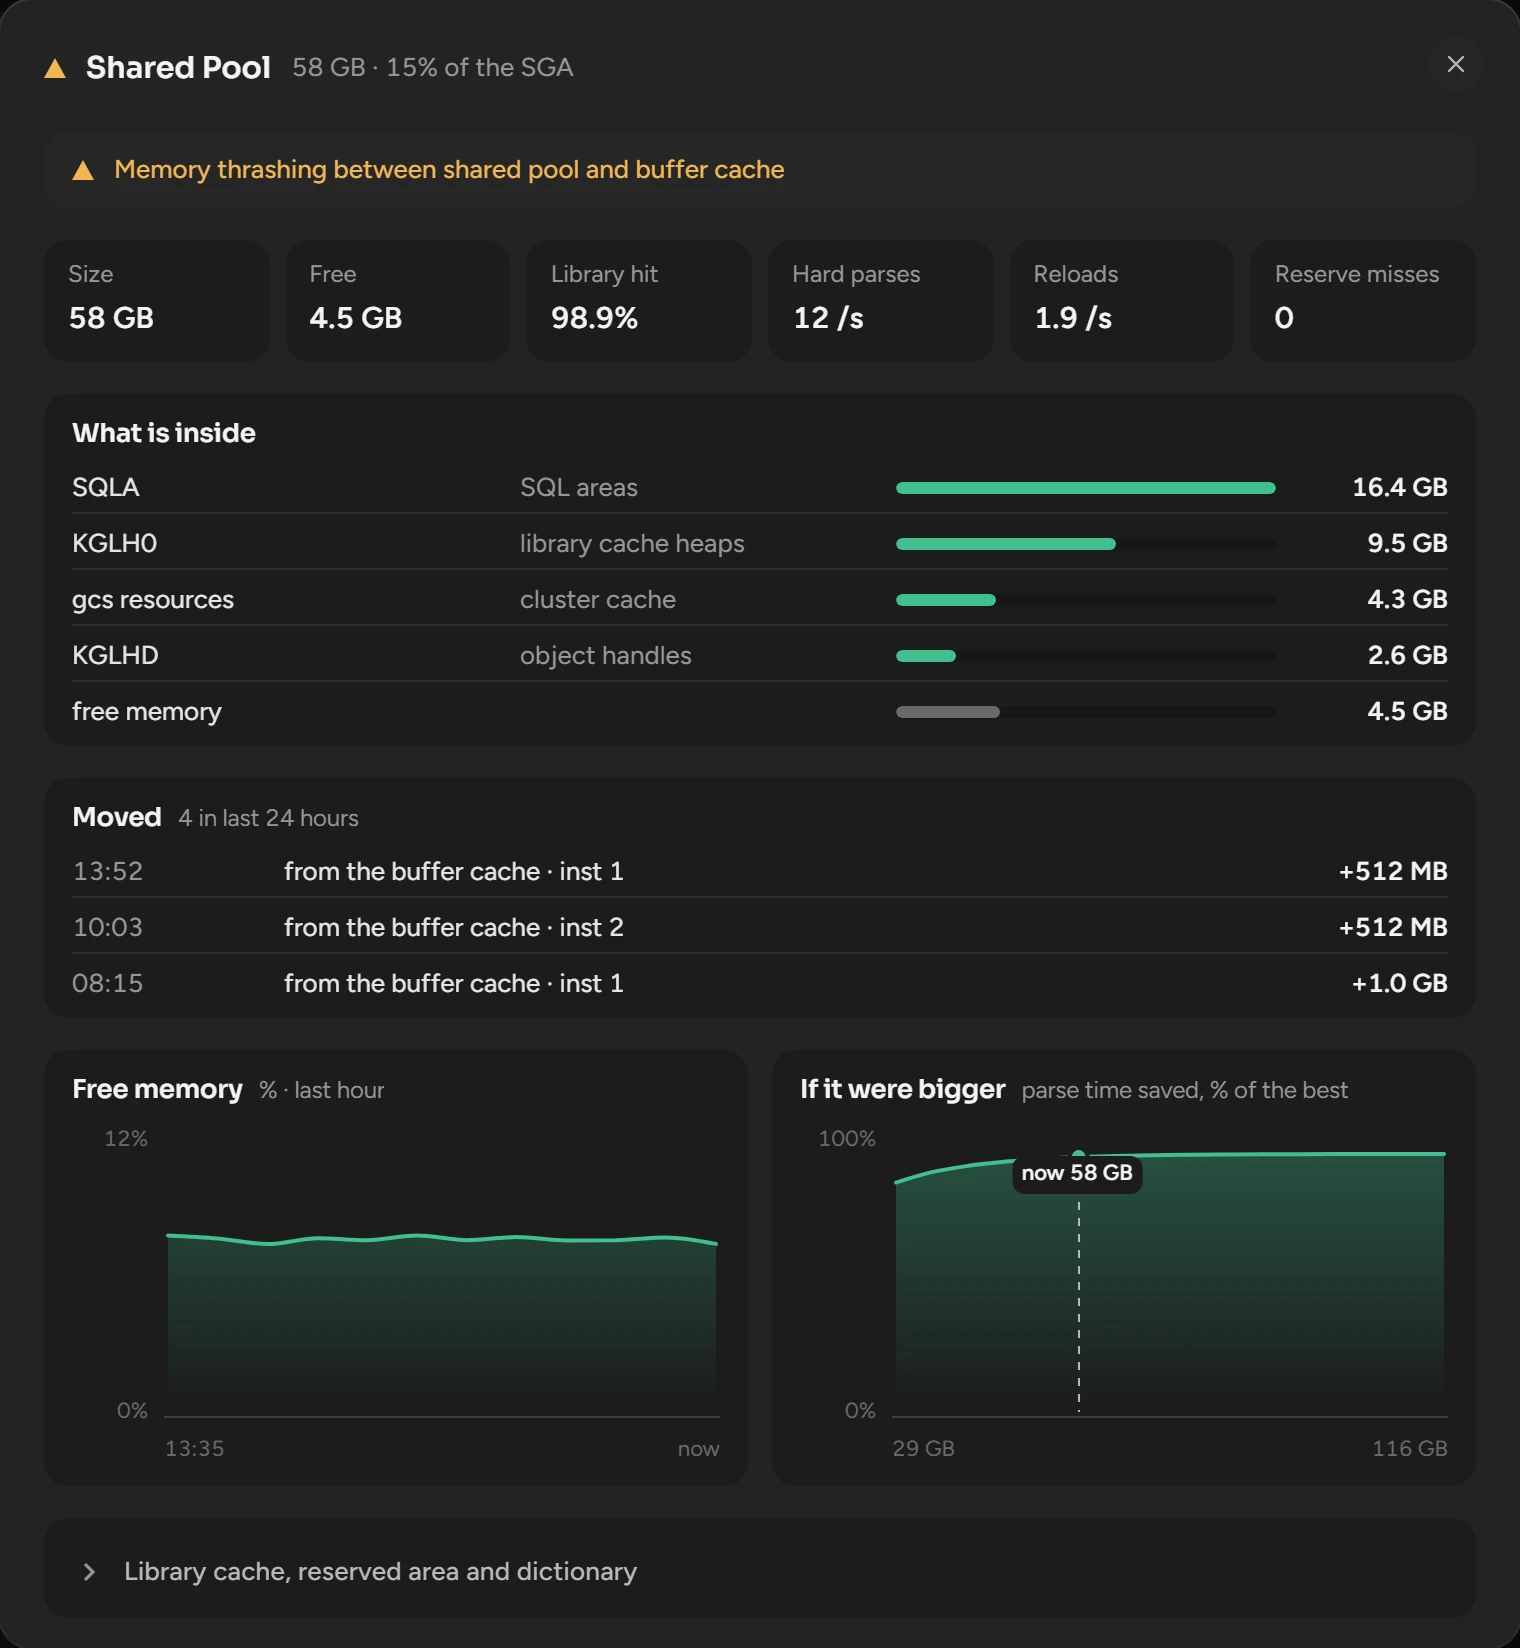
| Part | What it shows |
|---|---|
| Reserve misses | Failed requests in the reserved area of the shared pool. They come before ORA-04031. |
| Spilled | The share of PGA work areas that spilled to temp. |
| What is inside, Who is using it | The largest allocations, or the six processes with the most PGA. Click a SQL_ID for its SQL details. |
| Moved | The last three resize operations. |
| If it were bigger | The Oracle advisor, with a dashed line at the current size. |
Watch the instance live
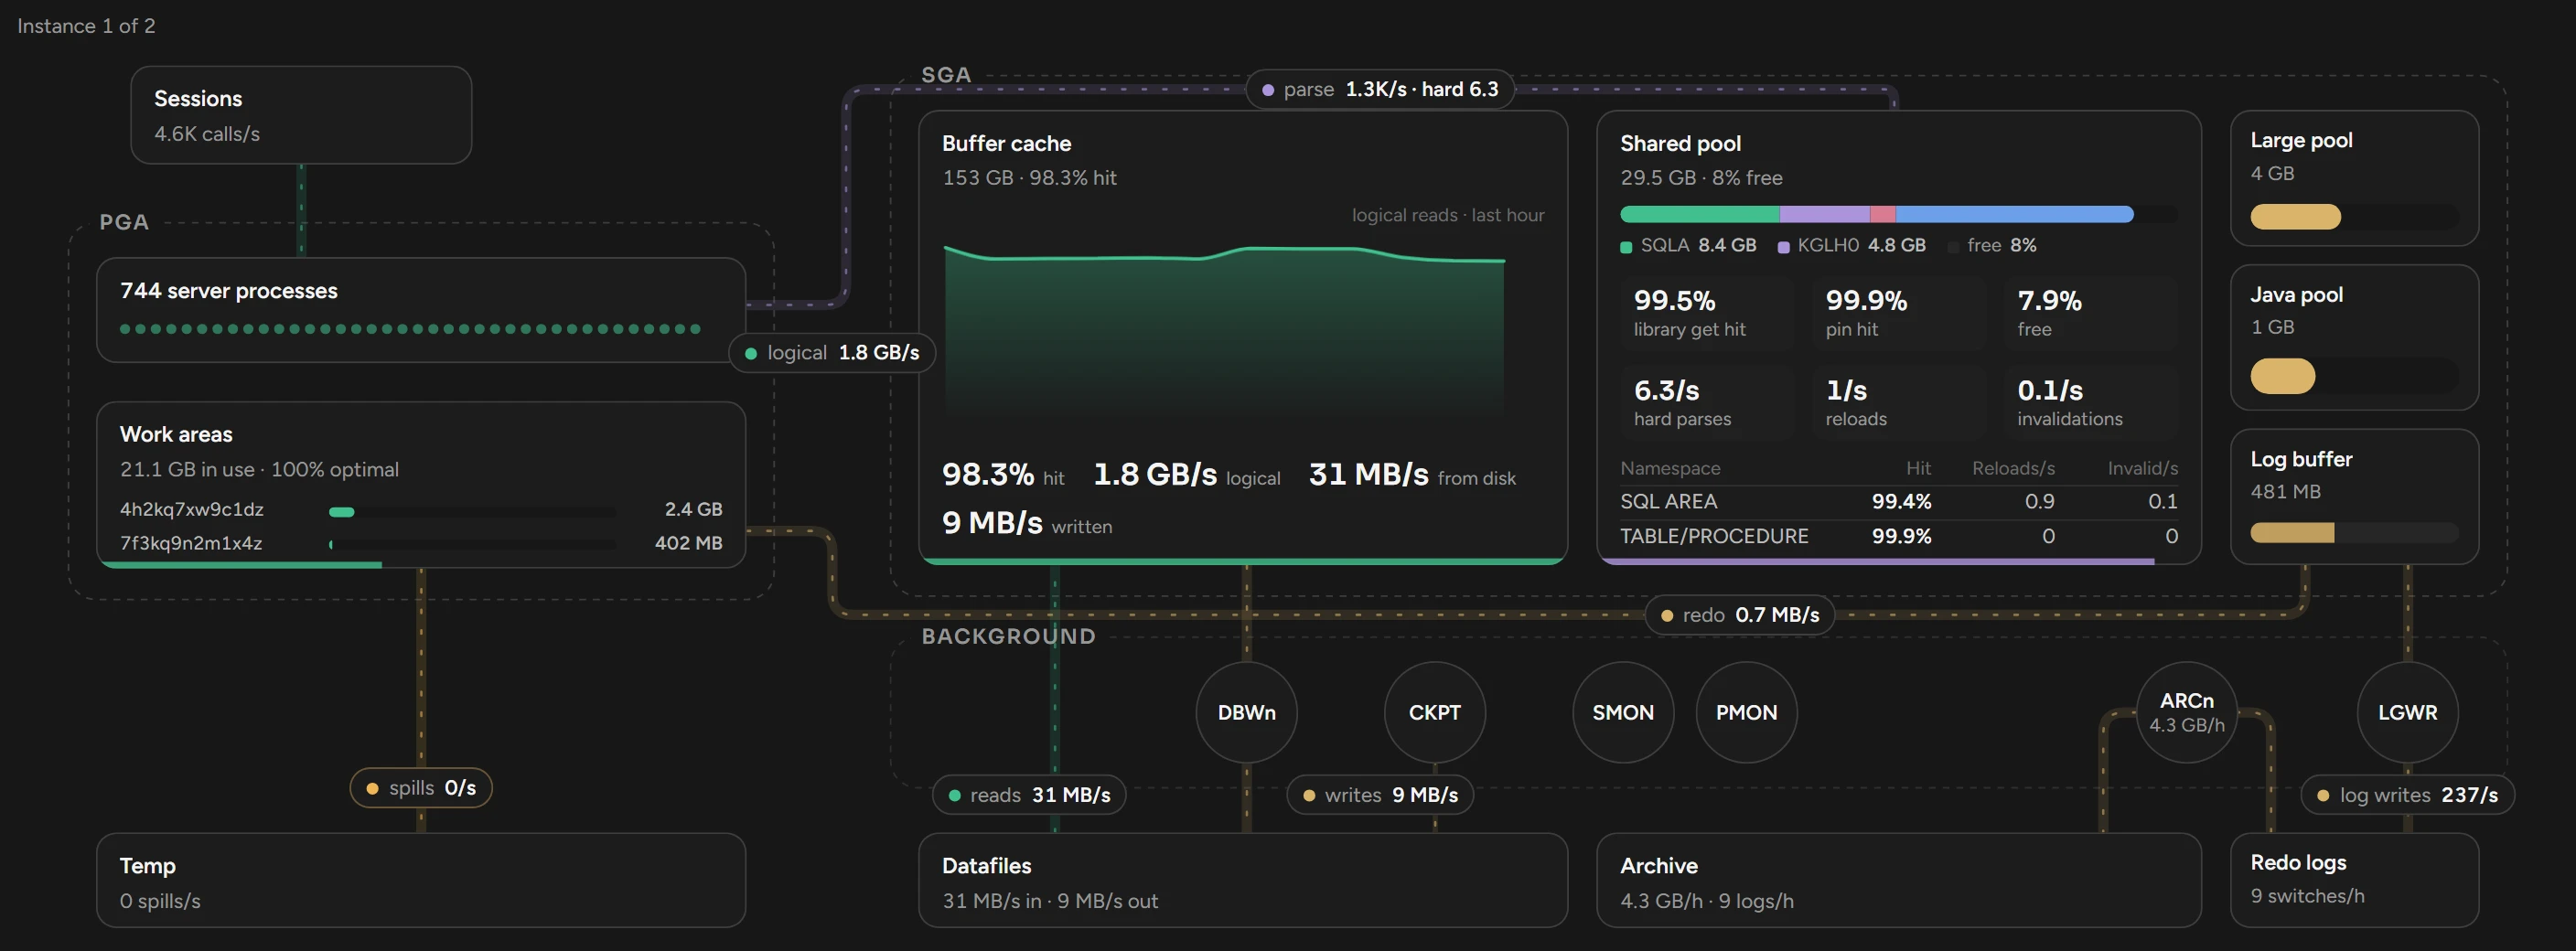
The Live tab shows one instance as a diagram, from the sessions to the datafiles. Points move along each path at the speed of its rate. Click a box to open its panel.
The diagram refreshes every 30 seconds. With All selected, it shows the first instance.
Related
Updated October 30, 2026